6 years ago / Admin
Over recent years, there have been increased technological advancements especially after the introduction of the internet. This means that the amount of information that the average person is being exposed to at any given time has risen significantly. With this marked influx of information, it has become the norm for most people to tune most of it out. So how exactly can advertisers and other stakeholders deal with this? That’s where infographics come in. They allow someone to pass information in a visually appealing manner that is eye catching and attracts attention.
For the most part, the purpose of an infographic is to engage, summarize and inform. Making an effective infographic requires you to collect data, write compelling text and present them in a visually appealing way. Human beings are highly visual. 90% of the information that comes into the brain is visual. So to get a point across, you need to tap into this.
At times, creating a simple infographic can be a hard and daunting task. This is especially true if you’re using the wrong application/ tool. Some of the available tools e.g. Adobe In-Design, Photoshop, Canva etc. are complicated and costly. This can be a huge drawback especially if you just want to create a simple infographic. Other tools like MS Paint and PowerPoint are too basic and don’t offer much in terms of features.
If the issue is it’s hard to find an infographic tool that is easy to learn, cheap and works best for you, you need not worry anymore. Introducing Piktochart.
Piktochart is a cloud based application that allows users to create simple infographics. It is free and allows users without an intensive experience in graphic design to create high quality and visually appealing infographics. It is completely user friendly and you can use it to create fantastic visual content without having to waste lots of time doing so. It has a number of inbuilt features which allow you to customize your content to your liking.
Since its introduction in 2012 Piktochart has accrued over 10 million users.
Pros:
Cons:
Go to www.piktochart.com. Click on the Sign up option.

Proceed to fill in your details and click on Create Account. Alternatively you can sign up with your Facebook or Google accounts.

Once you’re done you’ll be redirected to a page where you’ll be required to fill in more details. Do this and click on Submit.

After this you can now begin designing your infographic.

Click on the Infographic option on the left side of your screen. This will give you a bunch of templates to choose from. You can also create a blank template and start from scratch.
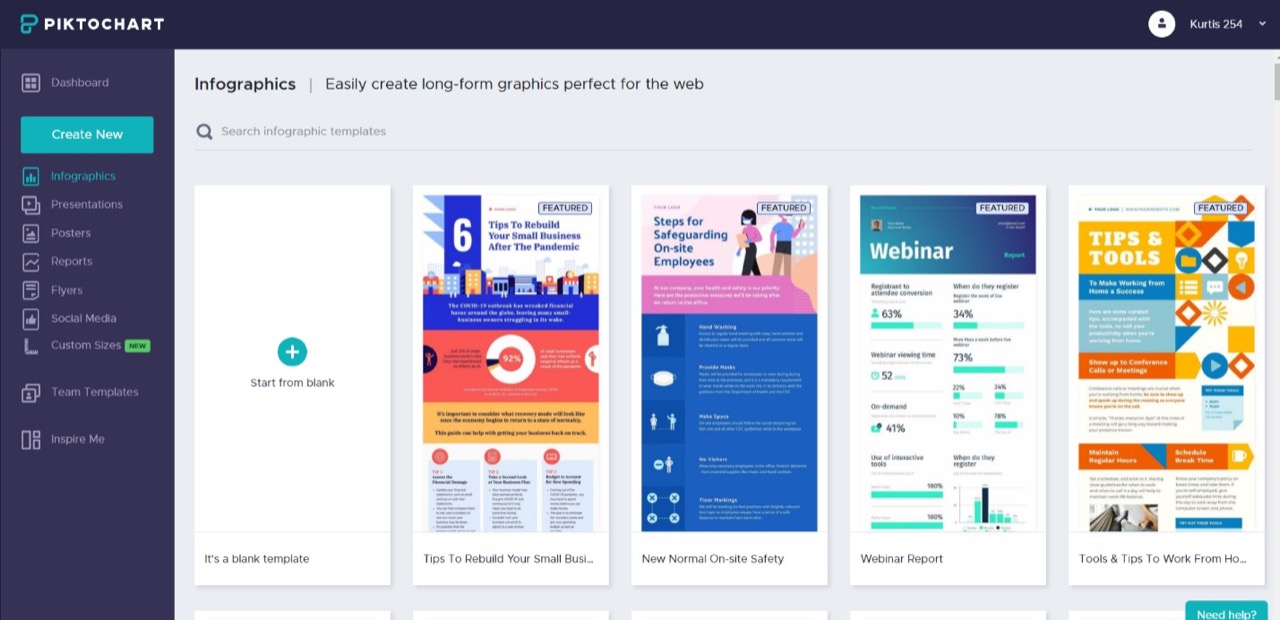
After clicking on the blank template a page appears where you can now create your design.

Step 3: Set background
Click on the Background icon on the left of your screen. Pick an appropriate background, click on it and it will be automatically added to your canvas.

For free images go to imagesload.net. Search for an appropriate image and download it on your device. Go back to Piktochart and click on the Graphics icon. Choose the Photos option.

Click on the + icon to upload your downloaded image to your canvas. Here is how mine looked like
(https://imagesload.net/view/a-disappointed-man-transparent-background-png/WAlfz)

Click on the Text option on the left screen. Drag the text box onto your canvas.

Once you’ve added the text options appear above your canvas which you can use to edit your text such as font, fill, size, spacing etc. Customize your content accordingly.

Take your time to play around with the Graphics control, there are a lot of options you can use to customize your content.
To add charts, maps and videos click on the Tools option.
You can also add another block to your canvas. Just click on the + sign in the options right beside your canvas.
All in all it’s pretty easy to use the tools once you get a feel of them. The good thing is that Piktochart has a variety of commands which you can use to customize your content. So play around with all the different controls and within no time you’ll be a pro.
Here is how my simple infographic looked like after working on it for 10 minutes.

Once you’re done making your infographic click on the Download option. Proceed to choose the format in which you’d like to download your infographic.
https://imagesload.net/blogimg/09piktochart/013.png
You can also choose to share your infographic. Just click on Share and proceed to follow the steps.

This is how mine looked like. It’s a little simple but yours will be amazing after you get the hang of this software. It’s truly amazing!

Using Piktochart is easy and doesn’t take much time to learn the commands. It creates high quality content that is visually appealing and can attract people’s attention. What’s even better is that it’s free to use. How cool is that! All you need is your creativity and you can get to designing!
Read more6 years ago / Admin
Infographics are one of the most unique ways of sharing and communicating information in a visually interesting way. Infographics are the highest shared content type and therefore one of the best ways to communicate data. The population in this day and age prefers and responds to visual content better than they do to plainly written text. This is why visual content like infographics have become a popular way of communicating information.
But not all infographics are created equal. For every stunning design and great infographic, there is a low quality and confusing infographic. So it’s usually a hassle for most people who want to ensure their content doesn’t fall in the lackluster category. While infographics are easy to digest, they are not necessarily easy to create. From the perspective of someone who is not a designer, creating an infographic that engages, summarizes, and informs can seem like an impossible task.
The major issue for most people is choosing an infographic making tool that works best for them. If this is an issue that has been plaguing you, then you are in the right place!
It’s true that there are already numerous tools out there that you can use to create infographics. These include PowerPoint, InDesign, and Canva just to mention a few. The problem is that some of these well-known apps can be quite expensive. It doesn’t make sense to spend so much money if you’re just looking to create a simple infographic.
At times, it can take you too long to learn how to use these apps and this creates complications especially if you have limited time. Even if you do learn how to use them, the average amount of time you are likely to spend making an infographic is quite much.
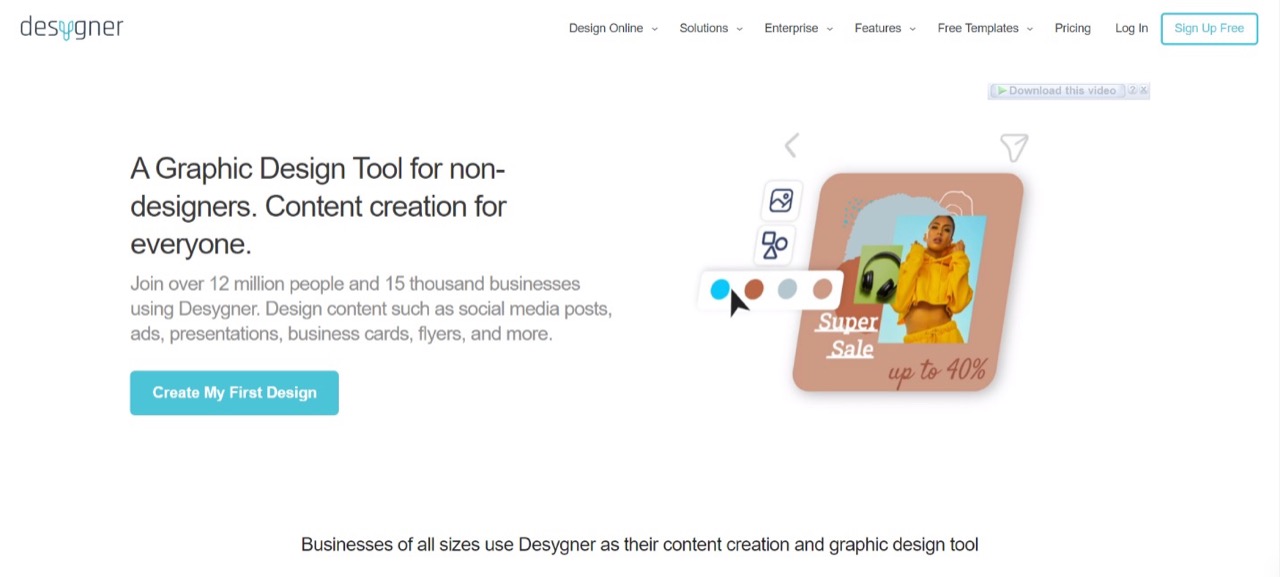
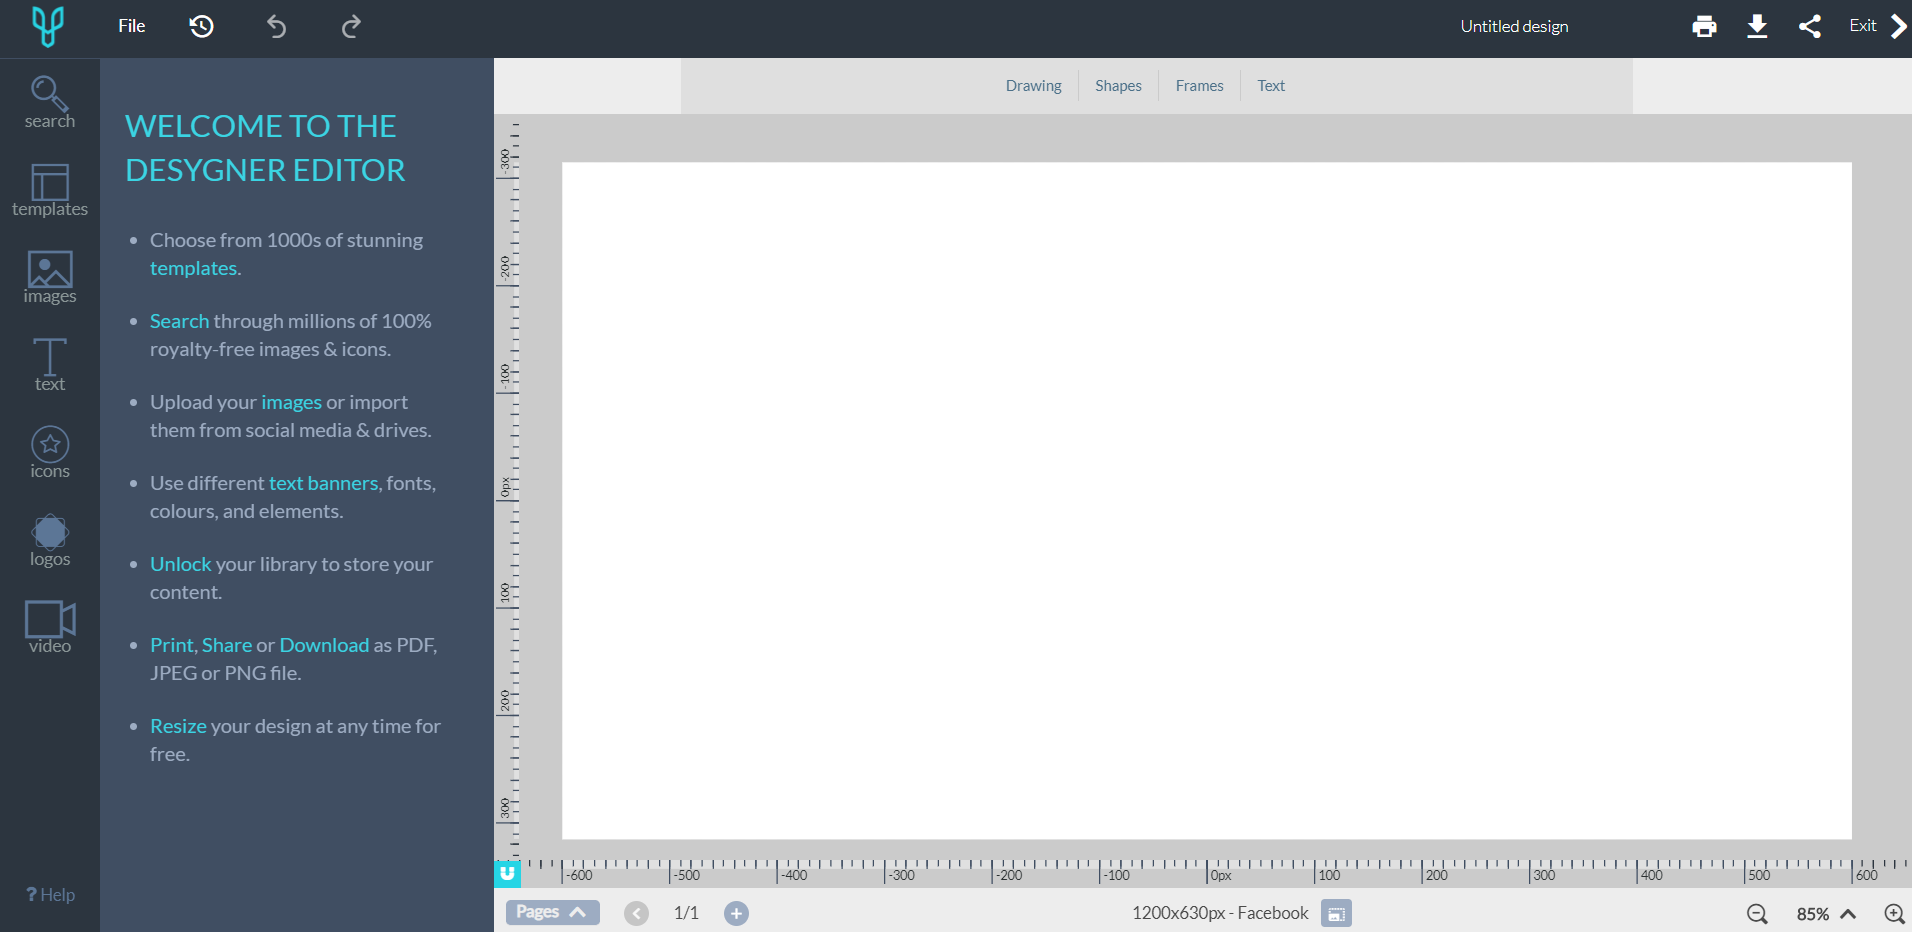
You need not worry about all this anymore! Introducing Desygner. It is an online infographic maker that is used to create all kinds of content from business posters, flyers, business cards, and much more. It makes designing simple and cut backs on the time one uses to create a simple infographic. With this tool you need not worry about the quality of your content! It allows you to create beautiful graphics that are eye-catching and which are detailed.
The tool prides itself in ease of use so you won’t have to spend a lot of time learning how to use it. The icing on the cake is that it is free to use! If you’re looking to get more features, you can always upgrade to the paid version, which is affordable.
Features
Desygner currently has over 10 million users.
Pros:
Cons:
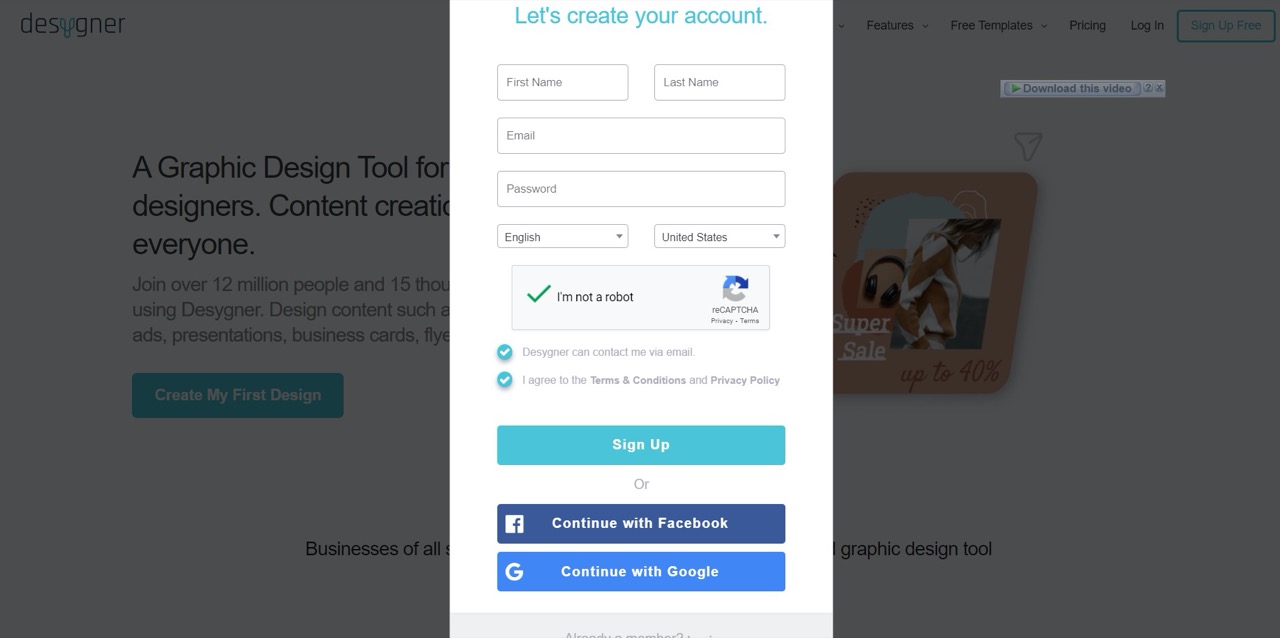
Go to www.desygner.com . After this click on Create my First Design.
A page will then appear where you are supposed to fill in your details. Do this and click on Sign Up.
Once you’ve signed up you’ll be required to choose:
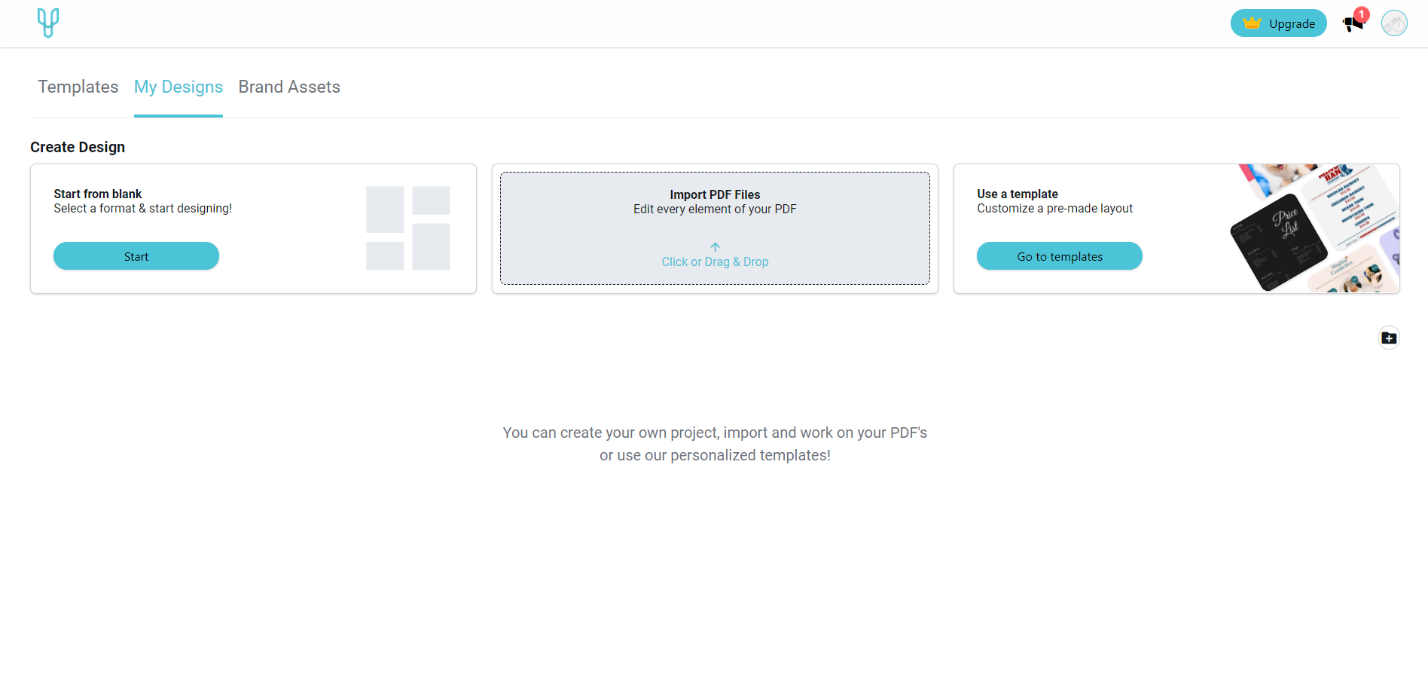
Pick one that fits your needs. I clicked on the Start from blank option. This gave me several options to choose for my canvas size.

Once you’ve chosen your custom size you will be directed to a page where you can now start working on your canvas.
For free, high quality images, go to imagesload.net on your browser. Search for an image that fits your purposes and then download it.
Go back to desygner and click on the Images command.
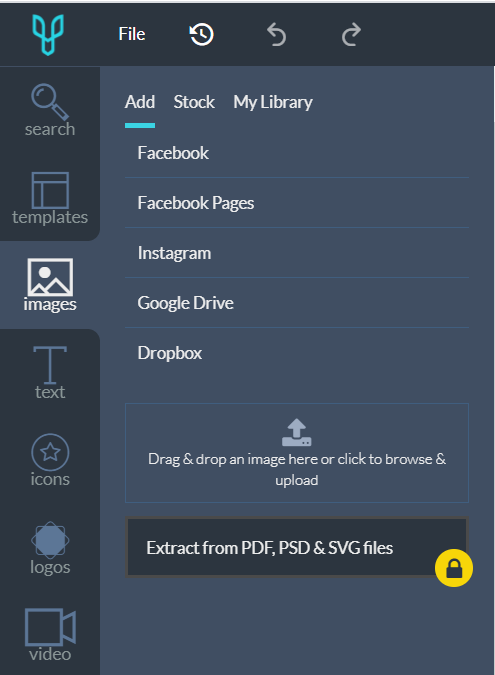
Click on drag and drop as is in the figure above and navigate to where you saved your image from imagesload.net.
Your image will be added to desygner. Point your cursor on the image. Several options appear. You can either add it as an image or add it as background. Click on the appropriate choice.
You can edit the background color of your canvas so it accentuates your background image. You can also reposition your background image Find these commands just above your canvas.
Remember, to add more images to your canvas, just follow the procedure above.
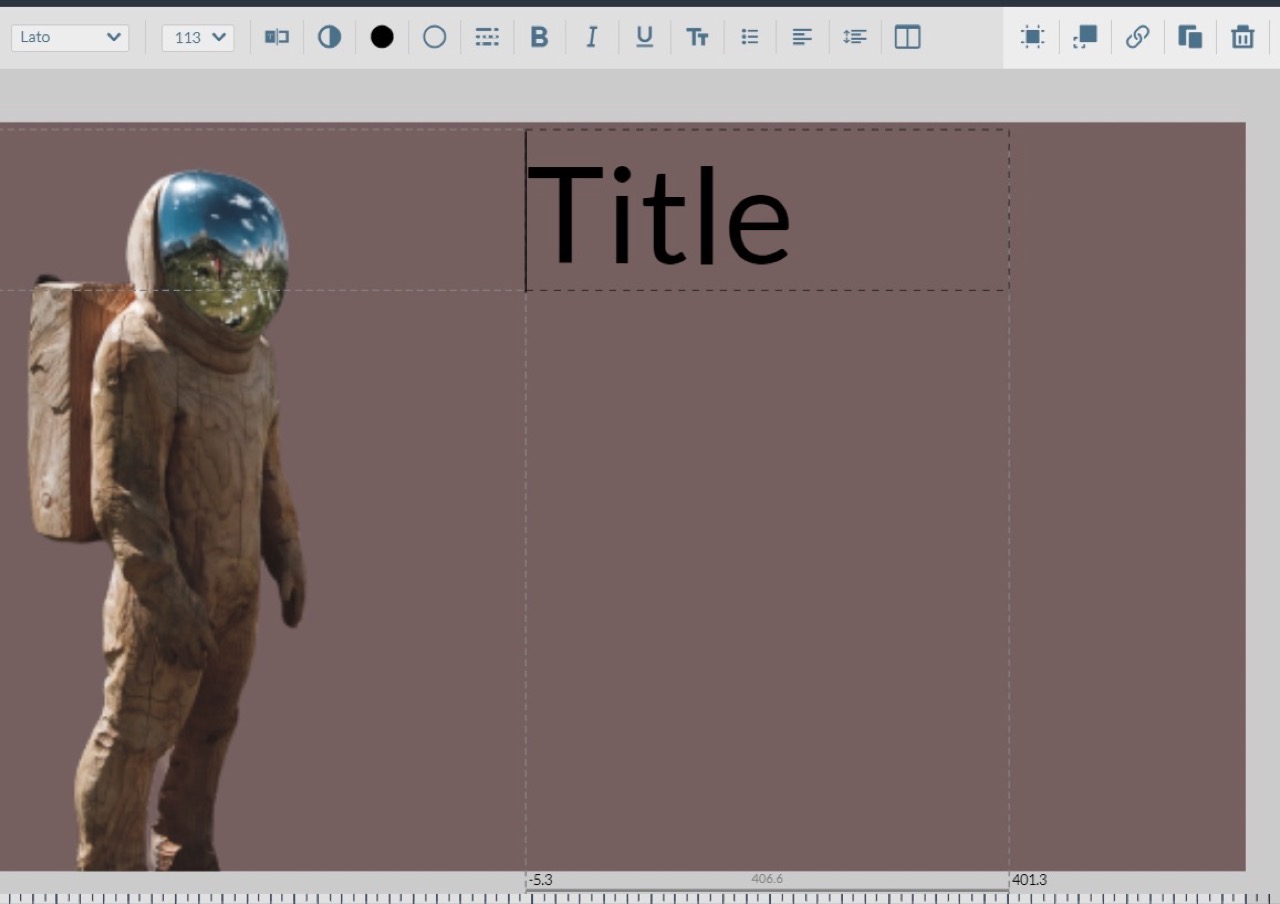
Here is the image I picked (https://imagesload.net/view/man-on-stars-transparent-background-png/uRaWz)

To add text, click on the Text tab. Choose what type of text it is and drag to your canvas.
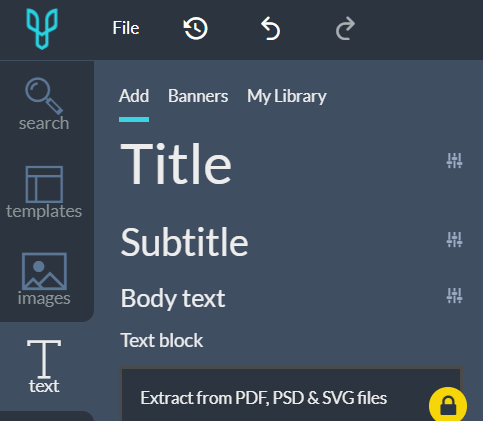
After adding your text, the text tab appears just above your canvas. Use this to edit and customize your text.
To add icons, click on the Icons tab and select one from the options.
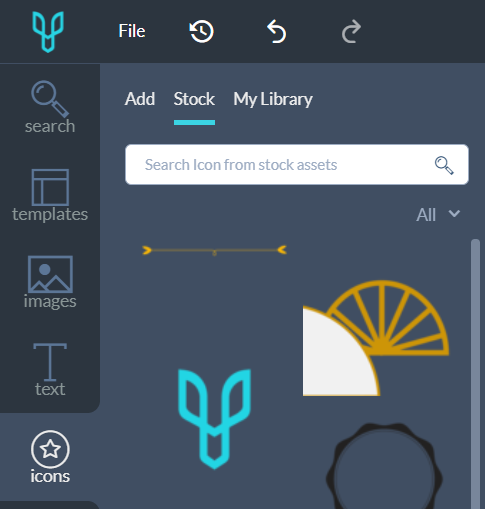
You can also choose templates and apply them to your canvas. Play around with the controls and within no time you will get the hang of it.
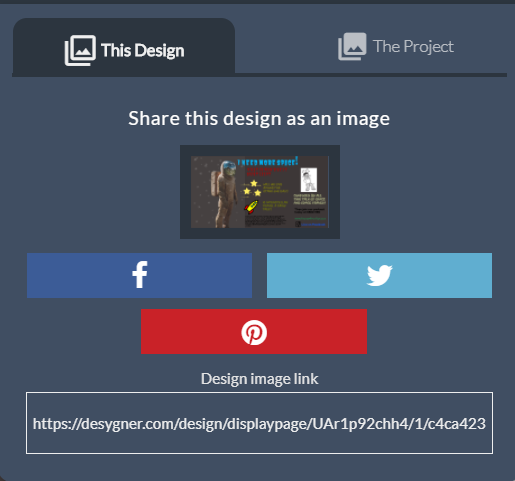
You will find these two options on the top right corner of your screen.
When you click on share the options that appear are as seen below. Choose the platform where you want to share your content.
When you click on download these options appear:
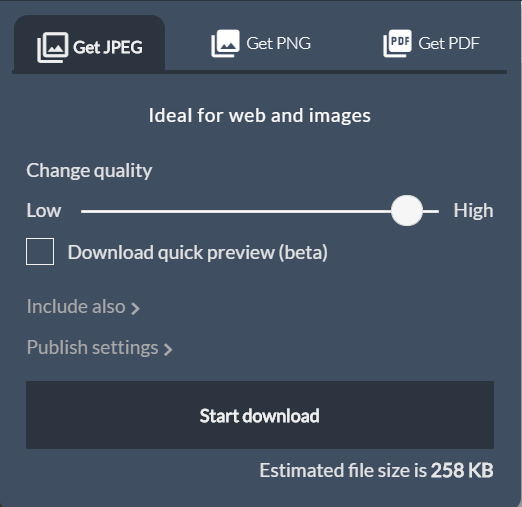
After this you will basically be done.
As you can see, creating an Infographic using desygner is easy. It took me 10 minutes to complete mine and this was my first time using desygner. Make a point of playing around with the controls and within no time you’ll be making better infographics than mine below.

Read more