6 years ago / Admin
Due to advancements made in the internet, people are being exposed to more information than ever before in history. In order to deal with this massive influx in information, we tend to tune a lot of it out. This is where infographics come in. Thanks to human’s visual processing capabilities, an infographic can communicate complex information more efficiently and effectively than normal text.
Eye-catching infographics with captivating images go a long way in ensuring people don’t overlook your content. The problem is creating a simple infographic can at times be a hard task. This is especially true if you have no idea of exactly what you’re looking for.
There are dozens of infographic making programs out there. Finding one that works best for you and doesn’t cost much may be harder than you think. With so many to choose from, you are more likely to pick one that is cumbersome and clunky. More famous infographic makers like InDesign, Photoshop and PowerPoint are quite costly and this is a huge takeaway. The learning curve for these is also large. So it’s quite understandable for one to desire to find a program that has a balance of ease of usability as well as affordability.
Enter Focusky! This is an incredible infographic making tool that helps to create visual arts that are eye-catching and mind boggling. It has a free trial so you need not worry about the cost. It’s easy to use and completely user friendly. With this program, you are guaranteed to spend less time creating your content without having to worry about the quality. It has a number of free templates to choose from and customize to your liking. Its commands and tools are easy to spot and use so as to edit your content desirably.
1. Flexible output format: It allows users to publish their content in various formats so as to easily share with others.
2. Zoom without blur: One can rotate the mouse on the canvas to enlarge all the details especially images without blurring.
3. Mental mapping experience: One can create animated content in a mental mapping style to capture attention.
4. Easy and Intuitive: The user friendly interface allows you create, publish and present your content easily.
5. Built in WordArt:You can use WordArt to add special text effect to your content.
6. Charts and Graphs
7. Social sharing
Here are some pros and cons as of 2020 seen from user reviews.
Pros:
Cons:
Due to how user friendly Focusky is, it is incredibly easy and super-fast to create an infographic. All you require is an account and your creativity to get started. Here is a step by step guide on how to create an infographic using this program.
Go to www.focusky.com. Once there click on the Sign Up button on the top right of your screen.
You are redirected to a page where you can fill in your details to sign up. Alternatively, you can sign up with Google or Facebook.

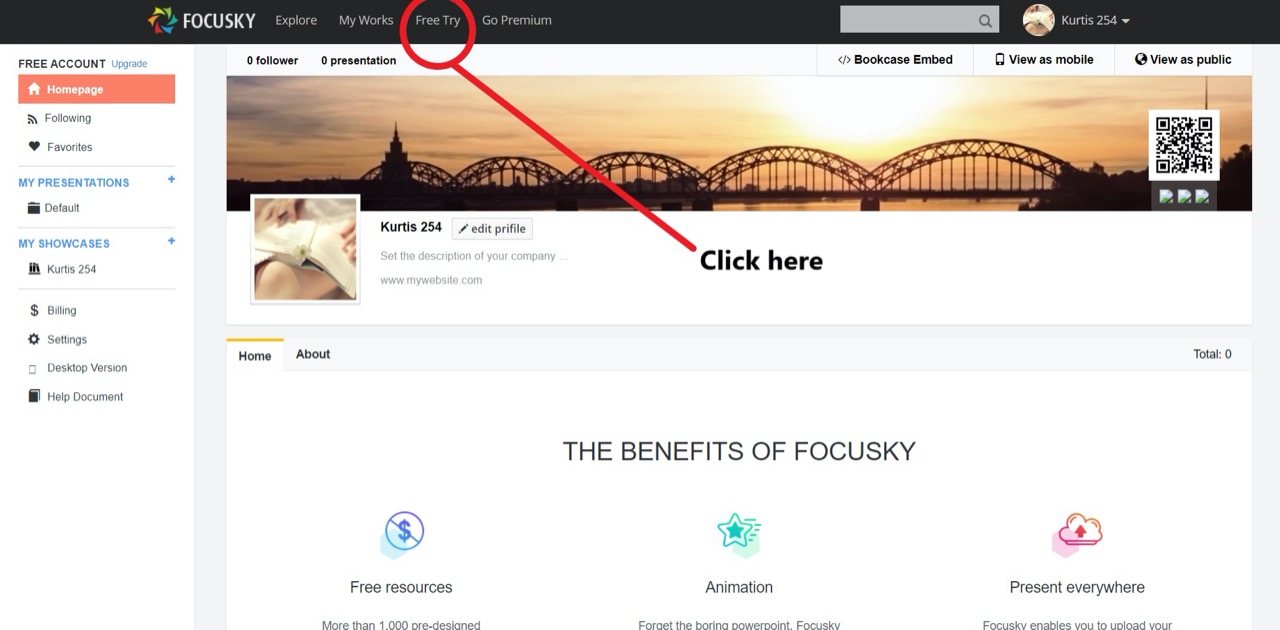
After signing up a page like the one below will appear. Click on Free Try so you can get the trial version of Focusky.
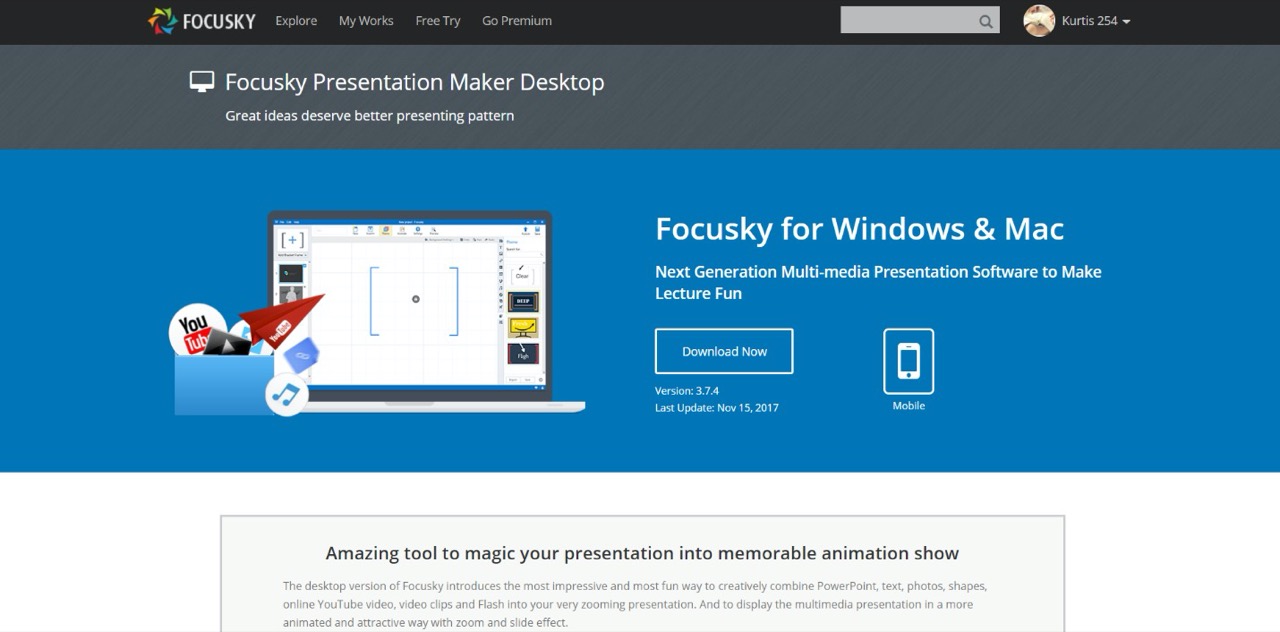
Once you’ve done this you’ll be required to download the app for your desktop. Click on Download Now and pick either for Mac or Windows.
After the Software is downloaded proceed to install it to your desktop. Launch Focusky and get started making your content. It took me less than 5 minutes to do this.
Once you’re done your window should look like this.
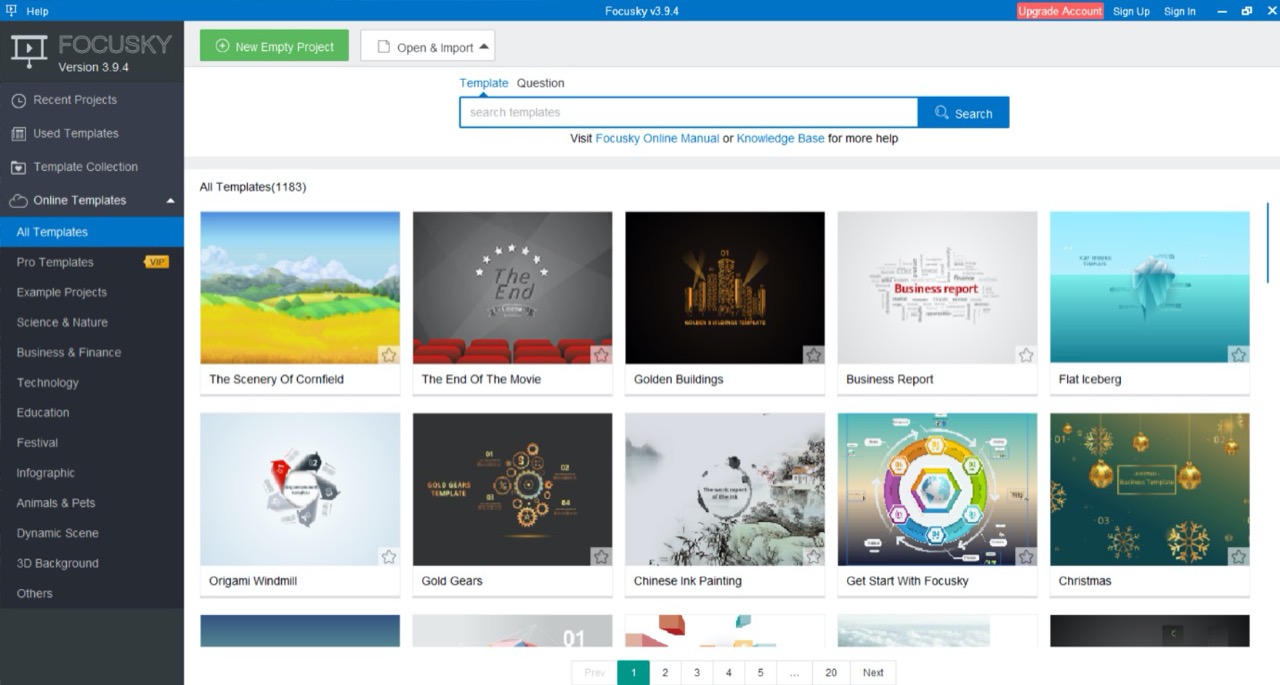
Now you are ready to go. You can choose a template from the already available ones or start a New Project.
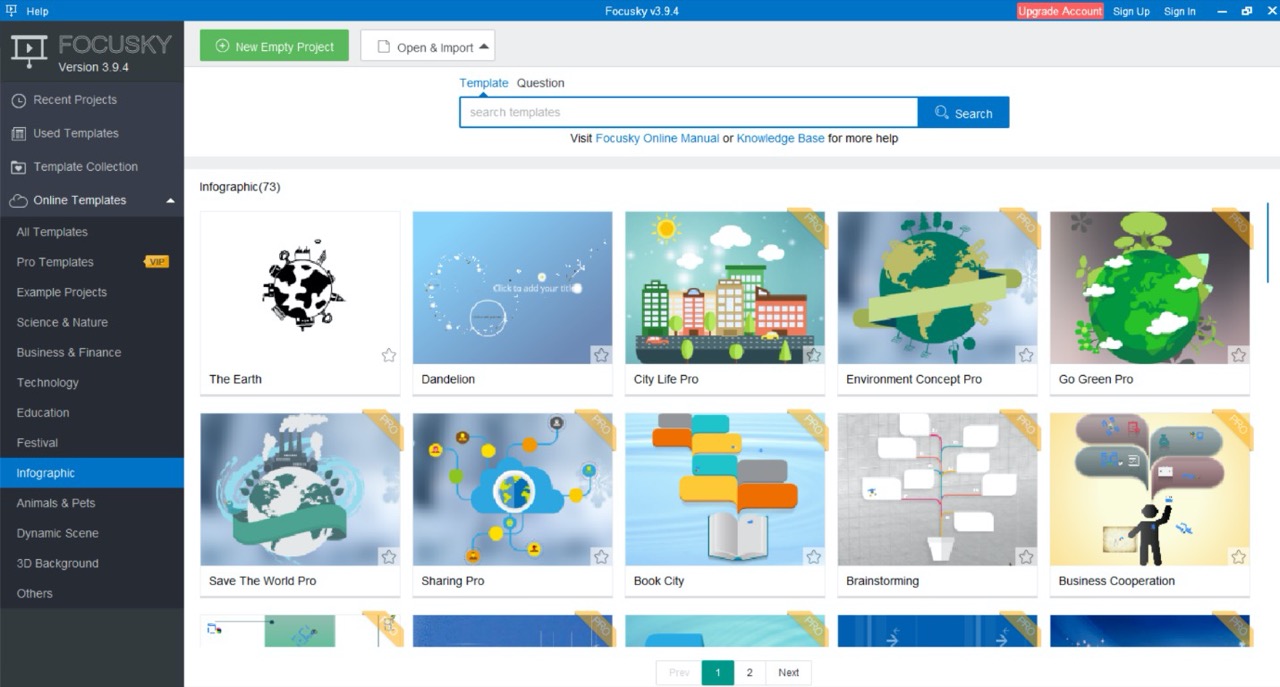
Step 1: Click Infographic option.
You’ll find this from the options list on the left of your screen. A number of templates will appear which you can choose from. If you’d like to start from scratch click on the New Empty Project option on the top left of your screen.
For my case I created a new project. So click on New Empty project and then choose a background color. Then click on Create. You can also choose the screen ratio.

Once you’re done, your screen should look like this.
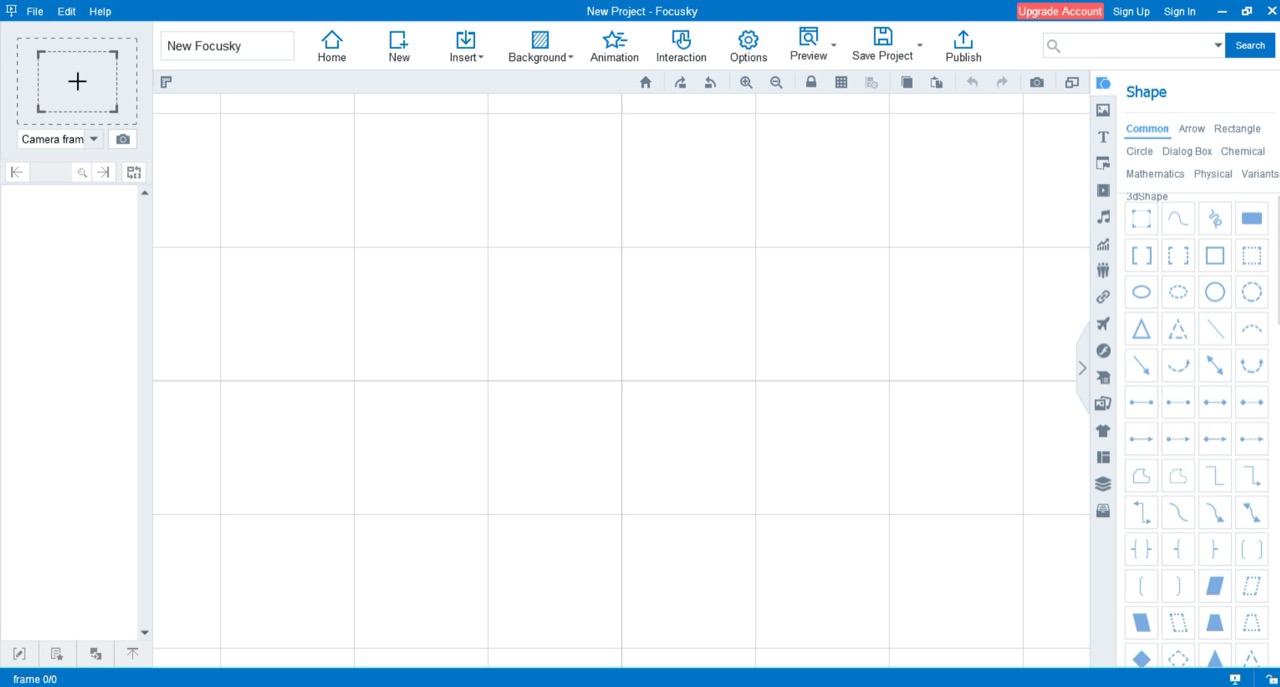
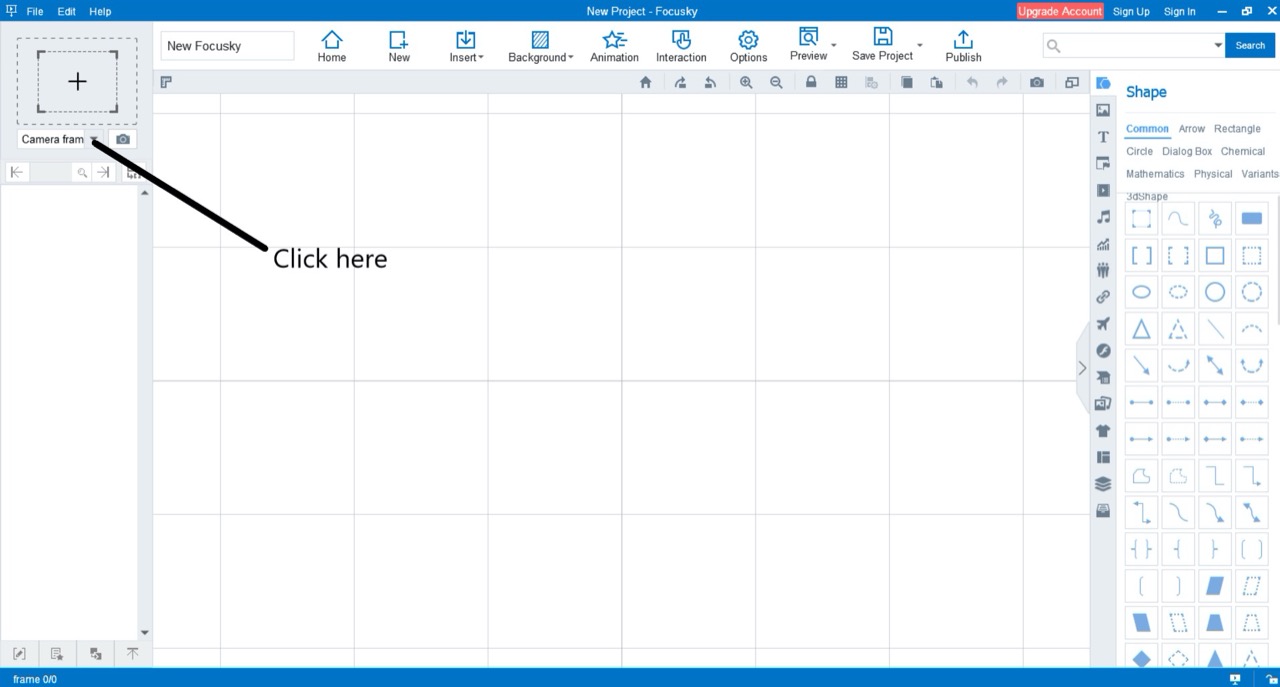
Step 2: Add a frame
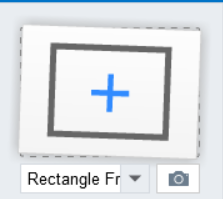
Click on the drop down arrow at the top left of your screen just below the files tab.
Choose the Rectangle frame option.
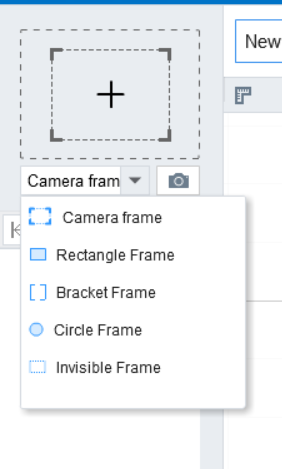
Drag the rectangular figure that appears above these options onto your canvas.
This is what your canvas should look like after:

Drag the edges of the rectangle to resize the frame to your suitability.
Step 3: Add background
Click on the Background option and choose a background. It will be added to your canvas automatically.
Step 4: Add image
For free high quality images go to your browser and type imagesload.net. Once you’re at the site search for an ideal image. Copy the URL of your chosen image.
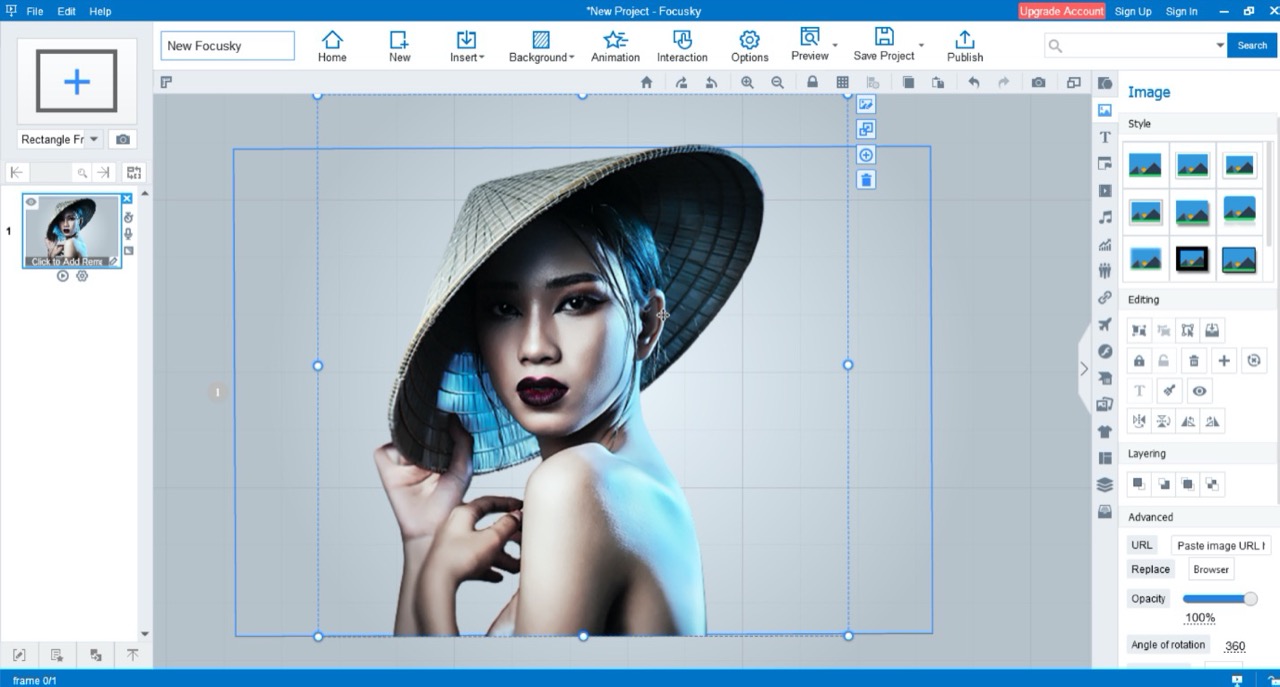
Go back to Focusky and click on the Images icon immediately to the right of your canvas. Paste your URL in the URL search textbox and click on Add. The image is added automatically to your canvas.

After adding your image successfully resize it so it fits in your canvas. You can also edit different aspects of your image from the options that appear on the right side of your screen.
Here is what mine looked like after choosing a photo from imagesload.net. (https://imagesload.net/view/girl-with-a-bamboo-hat-transparent-background-png/SzZE6)
Step 5: Add Text
Click on the Text (T) icon on the right of your canvas. After this a dialog box appears. Click on Add text and proceed to drag the box to where you want your text to appear.
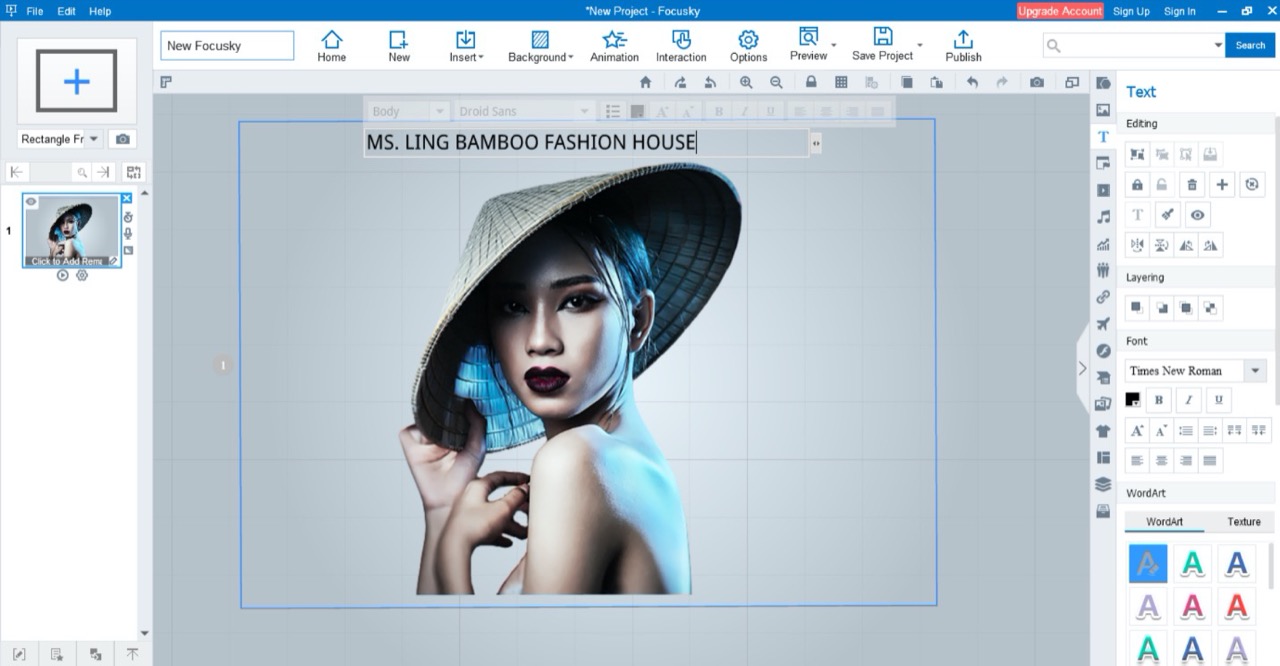
As you can see several icons appear which you can use to edit your text to your liking.
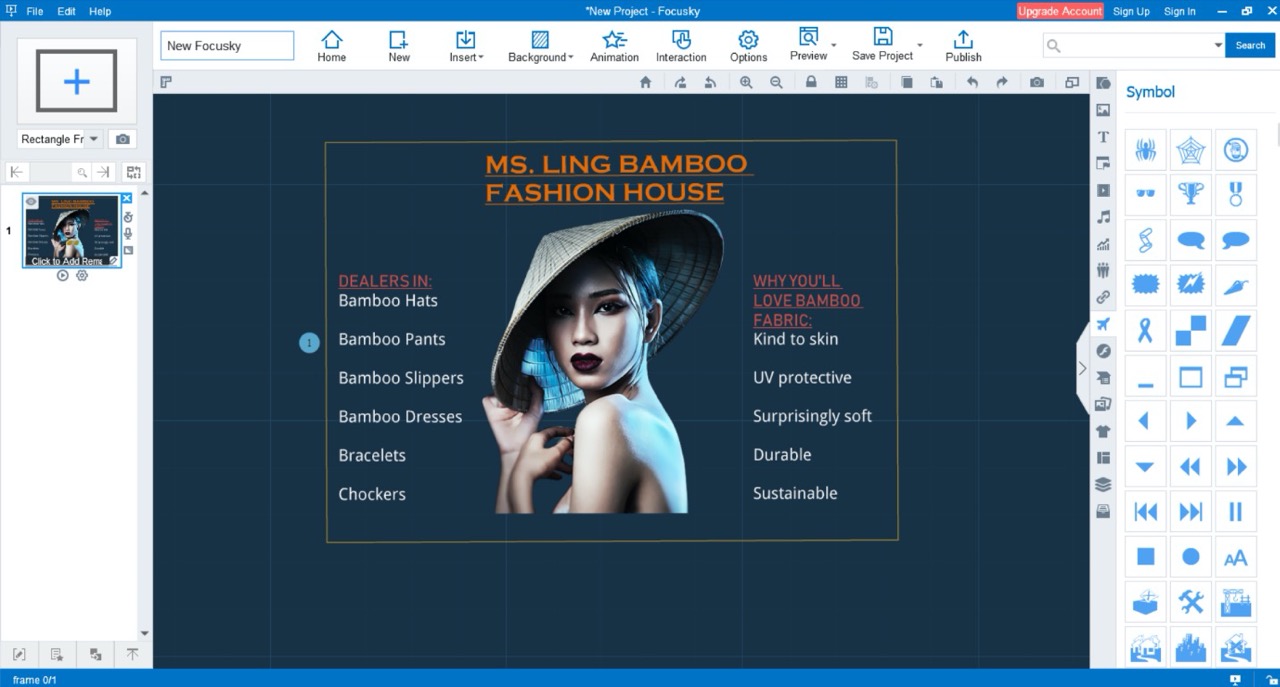
While you’re at this you can add shapes and symbols to your infographic.
To get the best output try as much as possible and familiarize yourself with the symbols on the right of your canvas. You can do a lot with them. It took me no less than 10 minutes to make my infographic and this was my first try! Mine is a little bit simple but here is what it looked like:
Step 6: Save project
Click on the Save Project tab and choose a folder where to save your content.
Step 7: Publish
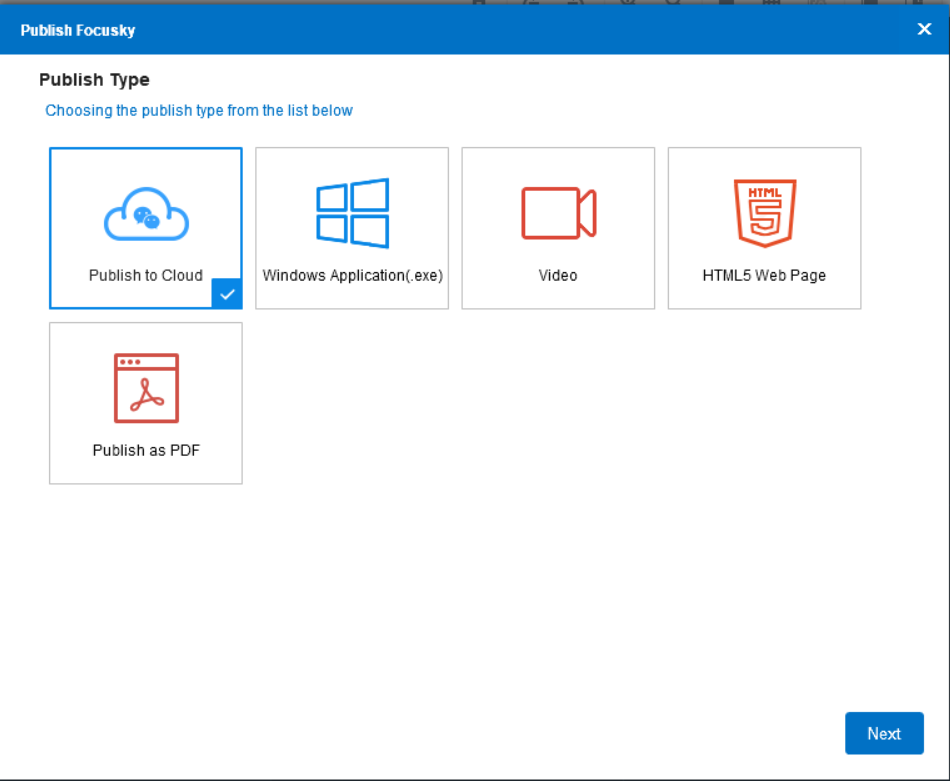
Click on the Publish tab and choose how you’d like to publish it.
And voila! You are done. With a little more practice you’re guaranteed to get better. It’s fast easy and doesn’t cost you a thing. Try playing around with the commands to get a feel of everything and you’ll be making killer infographics using Focusky in no time!
Read more6 years ago / Admin
Infographics are an essential tool when one wants to transform numerous amounts of information into easy to read visuals. People are much more likely to look at an infographic than they are through large chunks of data and information. Infographics can at times be time consuming to put together. But this is a small price to pay compared to the benefits you reap once you make them.
There has been a recent boom in the number of infographic making tools in recent years. The market has been flooded with these tools which has watered down the quality of infographics that are made. So I understand how tricky it is for you to pick a tool that is both user friendly and allows you to produce high quality content.
You need not worry anymore! Introducing Visme. It is a free content creation tool designed to translate boring data into engaging visuals. It is easy to use and you can get high quality content with minimal effort. It has a variety of great looking templates that you can customize to create amazing infographics.
You do not need any designing capabilities to adequately use Visme. It offers a wide range of fonts, free images and icons to customize your content. Their library of these tools is insanely huge. This is especially a distinguishing feature from all other infographic making software.
1. Automation
Visme comes with automation features for publishing and display. This allows publishers to set times to automate their online presentations and analytics to track the effectiveness of their published content
2. Organization and Collaboration
Visme allows users to organize content data in folders and provide role-based permissions to related teams and individuals. This promotes collaboration.
3. Everything in one place
With Visme, you can unify your entire content creation process in one platform to create store and publish your content.
4. Customizable templates
5. Charting capabilities- You can create charts and tables with this tool.
6. Image editing features.
Since its introduction in 2012, Visme has over 3.6 million users. Here are some reviews as from users:
Pros:
Cons:
Visme has a free trial option which can work for you if you’re looking to create a quick infographic.
Step 1: Log in to Visme
Go to www.visme.com.
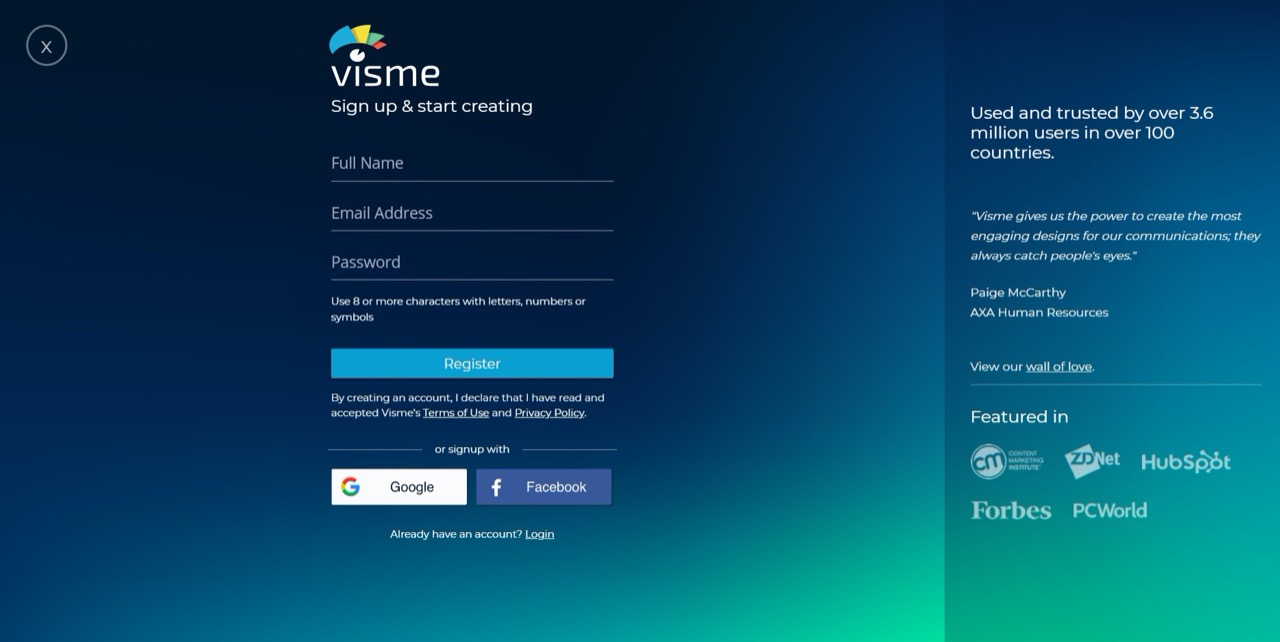
If you already have an account, you can simply just log in. If not click on the Sign Up Free icon.
Once you’ve done this, you’ll be redirected to a page where you’re required to fill in your details. Once you do this click on Register.
Step 2: Create new project
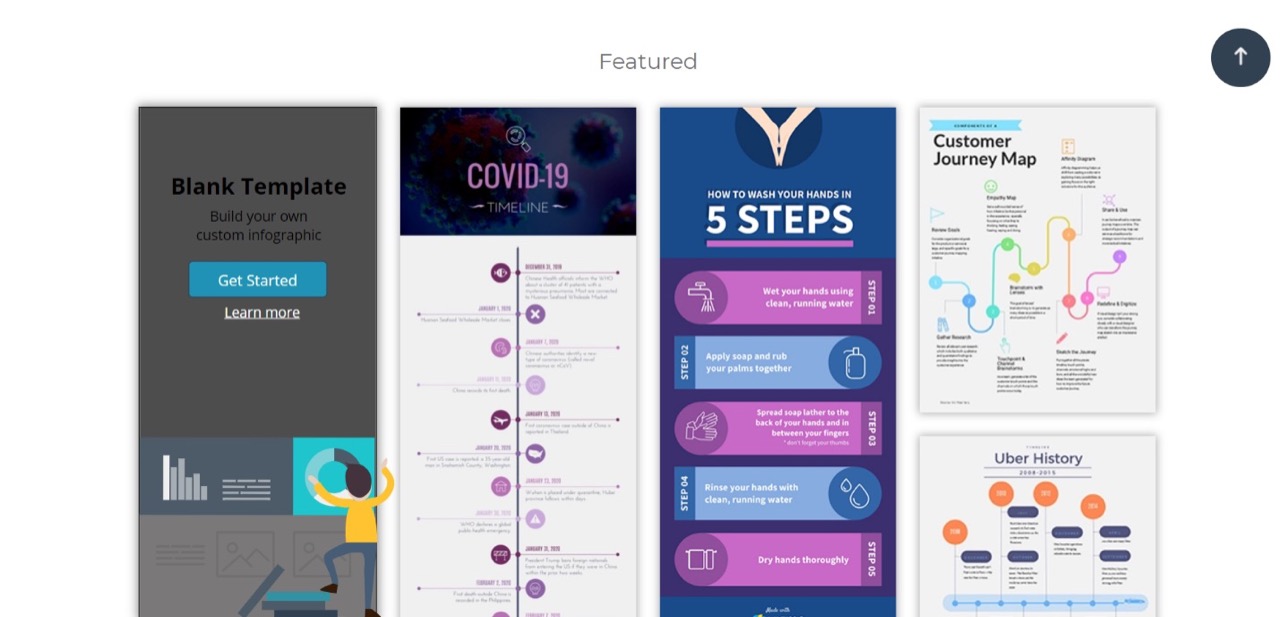
Once your account is successfully registered, click on the Create icon. This will direct you to a page where you can pick what type of content you want to create. For purposes of this guide, click on Infographics.

This will give you a bunch of template options to choose from. You can pick one of these inbuilt templates to edit and use. You can also create your own custom template by clicking on the Get Started button on the Blank Template option.
For purposes of this guide I’m going to create my own template. This opens up a page with a blank canvas which I can now start working on. To edit the canvas size, click on the blank canvas and a dialog box appears just above your canvas. Click on Canvas size and adjust the size accordingly.
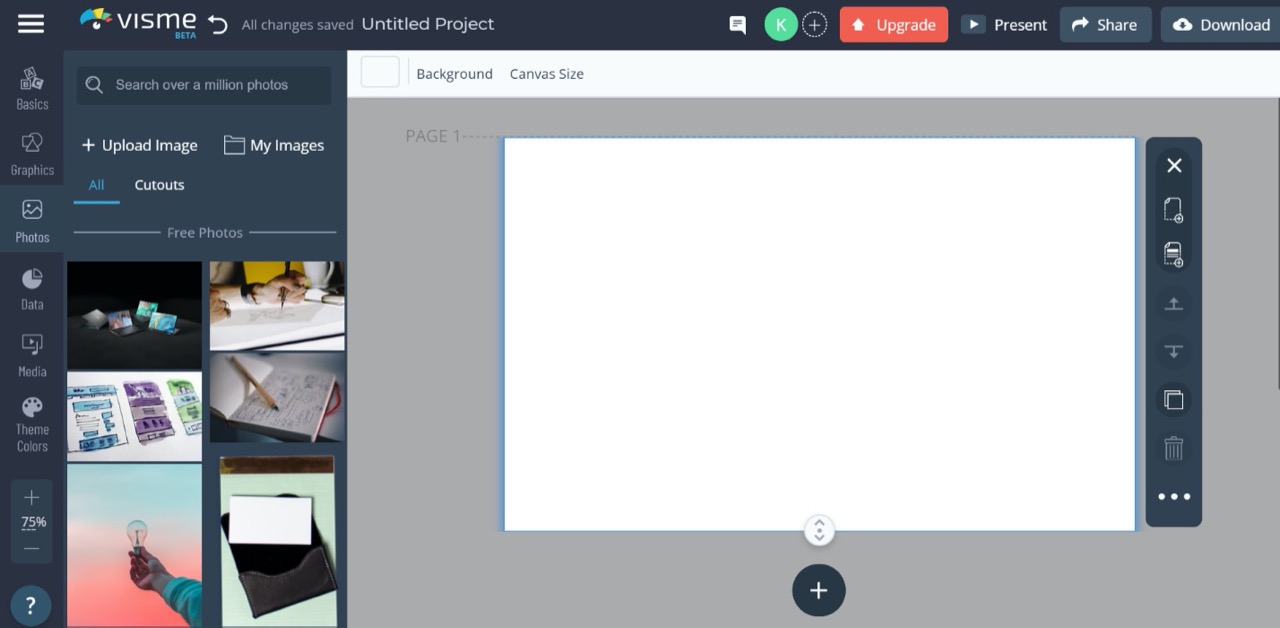
Step 3: Add a background image.
You can get free high quality photos from imagesload.net. Search imagesload.net on your browser. Once you’re on the page search for a suitable image and download it. Once you’ve downloaded it go to Visme and click on the Photos icon on the left of your screen.

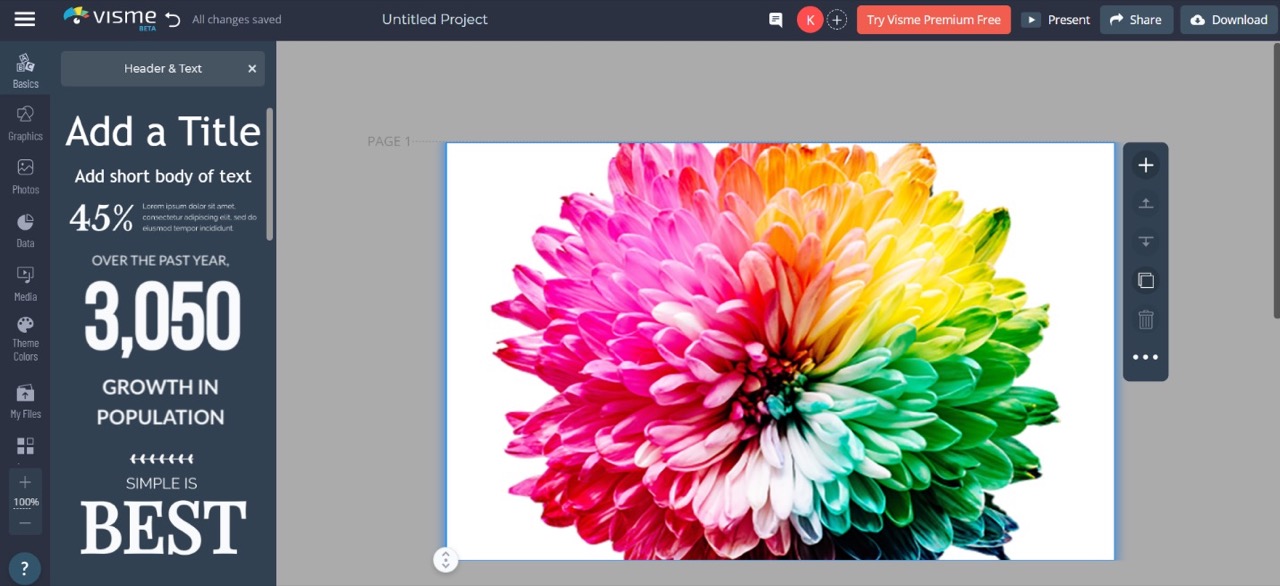
Click on Upload Image and proceed to navigate to where you saved your downloaded image from imagesload.net. Add the image to your canvas.
Here is what mine looked like after adding my free creative commons downloaded image: https://imagesload.net/view/multicolored-dahlia-flower-transparent-background-png/RKFZr

Note that you can edit your image adequately. Whether you’d like to alter brightness, the scale or even the color overlay. These options appear right above your canvas.

Step 4: Insert Title text
Click on the Basics icon on the top left of your screen.

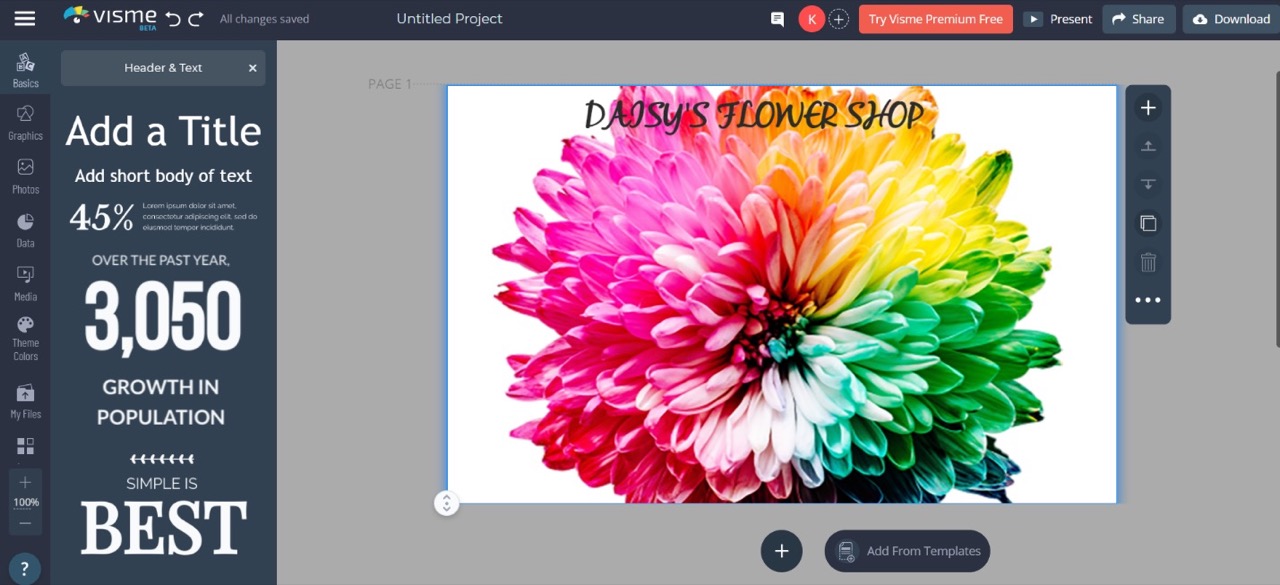
Click on the Header & Text option. Drag and drop this on your canvas and type your Title.
You can edit the positioning of your text box to where you want your Title block to appear. You can also edit the size of your text box by dragging one of the corners.
Step 5: Edit your text
You can edit different aspects of your text such as font, size, fill and more. Make sure the background does not obscure your text from vision. This is how mine looked like:

You can also edit the fill of your text box. Just click on the More option just above your canvas. Make sure your text box is selected for this.
Step 6: Add new block
You can add a new block to your canvas if you’d like to divide your infographic in sections. Simply click on the + icon below your canvas. This will add a blank block which you can edit to your liking. You can add multiple blocks to your infographic.
You can also edit the size of you blocks.
Step 7: Add other relevant information
If you wanted to create an infographic with charts and graphs click on the Data icon and pick whatever you require. Be it graphs or charts you can enter the relevant data to create these in your canvas.

Simply click on your preferred data presentation format and proceed to add your data.
You can add audio and video by clicking on the Media tab.
Add more images to your canvas but instead of adding them as background image, add them directly to the canvas. Add more text to your infographic to make it look better.
Now you’re virtually done creating a simple infographic! How easy was that!
Click on the Download button to get your infographic in PNG or JPG format. You can also download your infographic as a pdf file.

Alternatively you can click on the Share button to publish to the web, share privately or embed to your website.

You can find the Download or Share options on the top right corner of your screen.
Here is what mine looked like.

Of course your infographic will look much better than mine. Just take your time and play around with the controls to get a feel of Visme before you immerse yourself into making your infographic! It is easy and it doesn’t take much time.
Read more