6 years ago / Admin
Emaze is an impresively simpe online platform where you can create some great content like infographics with ease. Wouldn’t it be great if creating infographics was as simple as writing regular old text-based blog posts? Usually, making visual content like this takes much more time, effort and skill than written word. For the most part, the purpose of an infographic is to engage, summarize and inform. Making an effective infographic requires you to collect data, write compelling text and present them in a visually appealing way. Human beings are highly visual. 90% of the information that comes into the brain is visual. So to get a point across, you need to tap into this.
Creating a simple infographic can be a hard task at times. True, there are a number of infographic making tools one can choose from. The issue however, is finding one that works best for you. Most of the available softwares are complicated and can be quite cumbersome at times. From Adobe Photoshop to PowerPoint to Adobe InDesign, most of these softwares are costly. This can be a huge deterrent especially if you are not looking to spend money to make a simple infographic. They also take longer to learn using and this especially is a huge put off.
Introducing Emaze. It is a free online content creation program designed to “emaze” everyone who comes into contact with your content. It allows users to create fantastic visual presentations without having to waste lots of time doing so. It has a list of different templates you can choose from to start working on your content. Each of these in built templates give the user an interesting visual hook to grab your audience’s attention.
Emaze was founded in 2009 and up to date has had close to 50 million users.
Pros:
Cons:
So how exactly do you create an Infographic with Emaze?
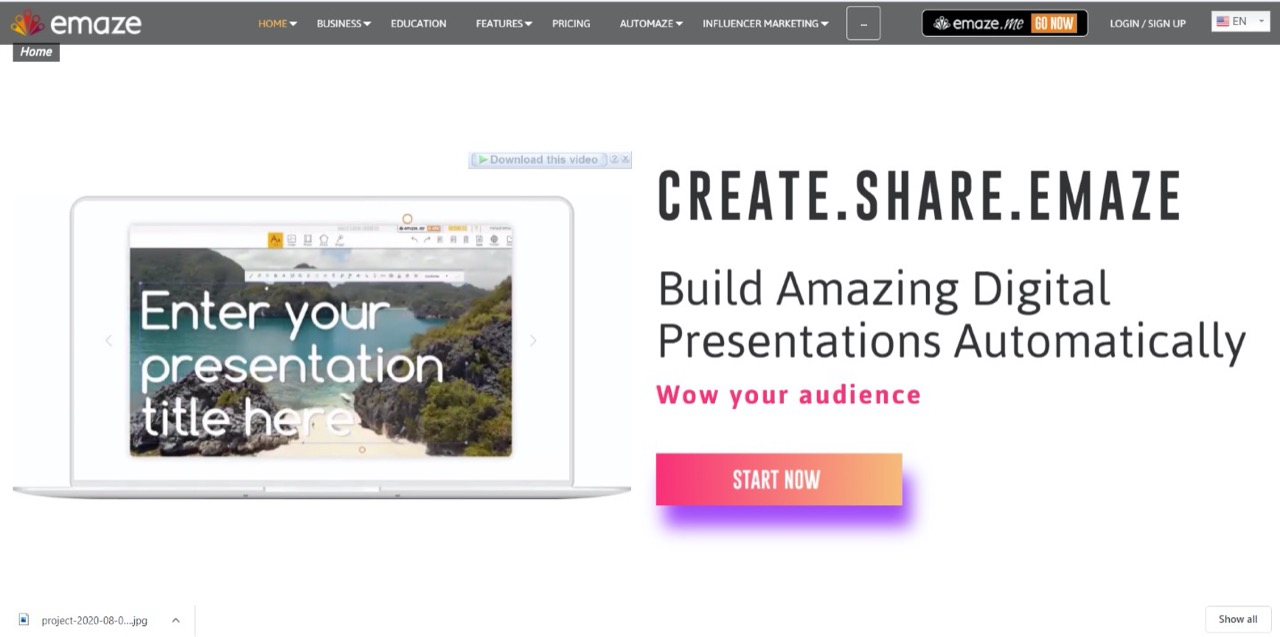
Go to www.emaze.com. Once on this page lick on the Start Now button if you don’t have an account. If you already have an emaze account, simply click on Log in.
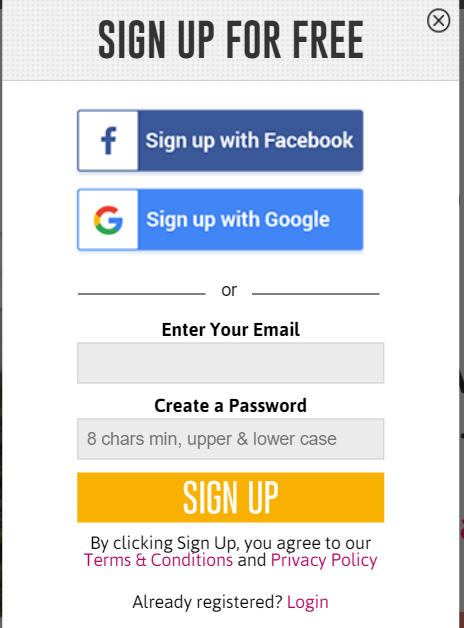
Step 2: Fill in your details
After clicking on Start Now a dialog box will appear requiring you to fill in your email and create a password. Alternatively you can sign up with Google or Facebook.
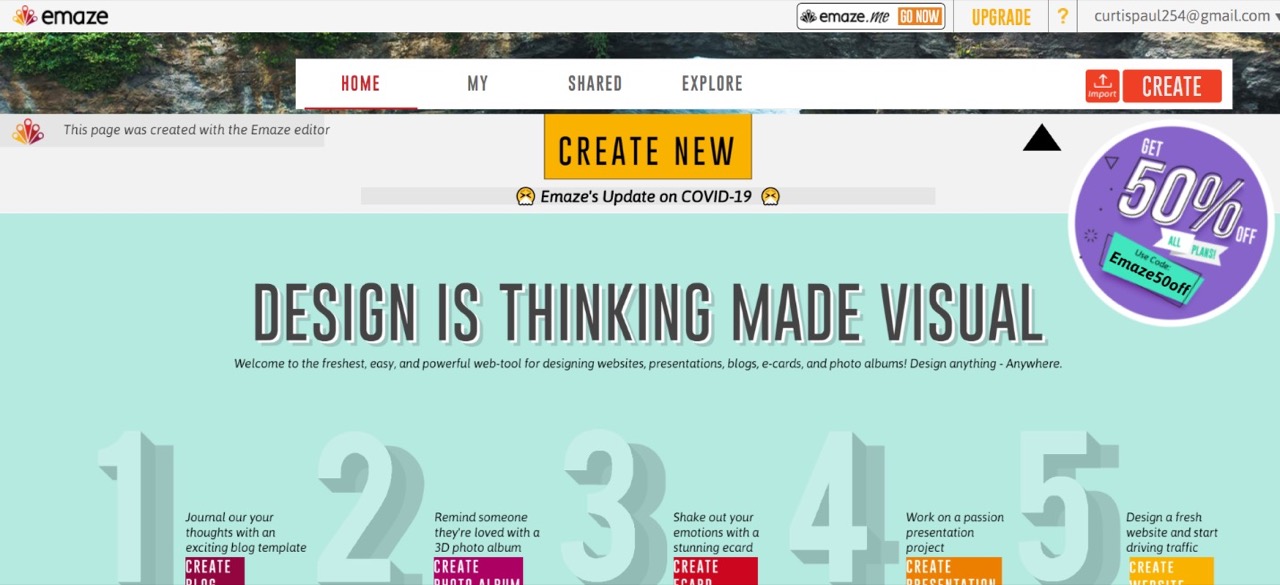
After you log in to your account you’ll be directed to a page where you can now begin designing. Click on the Create New option.
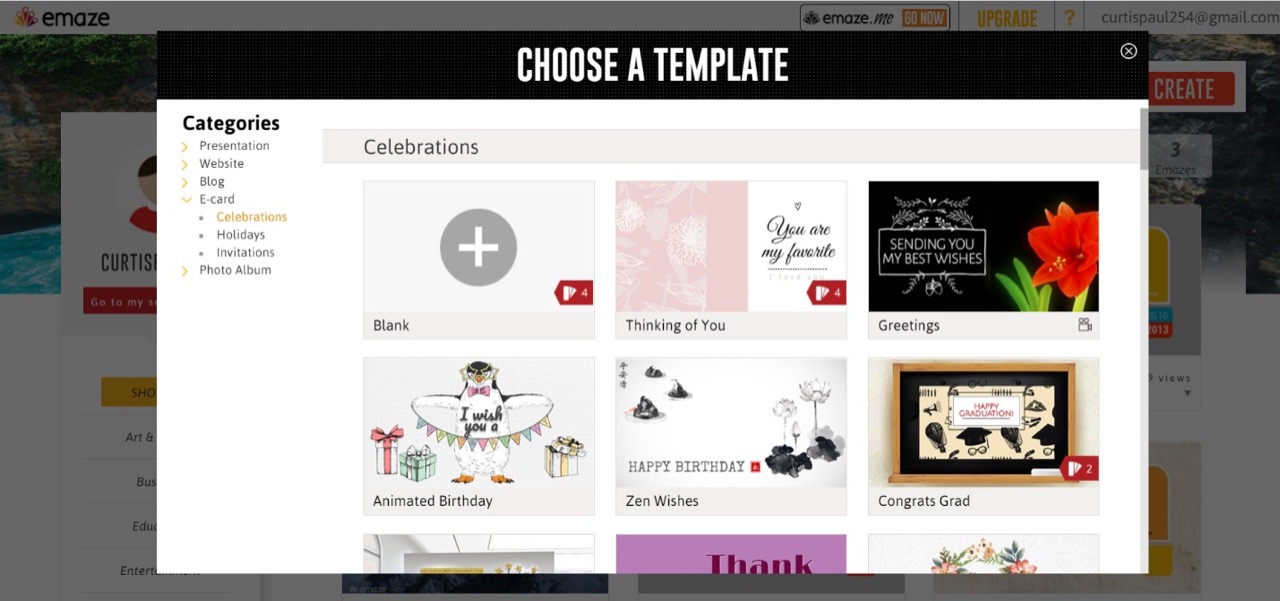
This will open a dialog box which requires you to choose what type of content you want to create.

Click on the E-card button. This opens a page where you can browse for an appropriate template that fits your needs. Note that we’re using the E-Card option because it’s the closest thing you can use to create an infographic with Emaze. Trust me, it will pass for a nice infographic with the right adjustments!
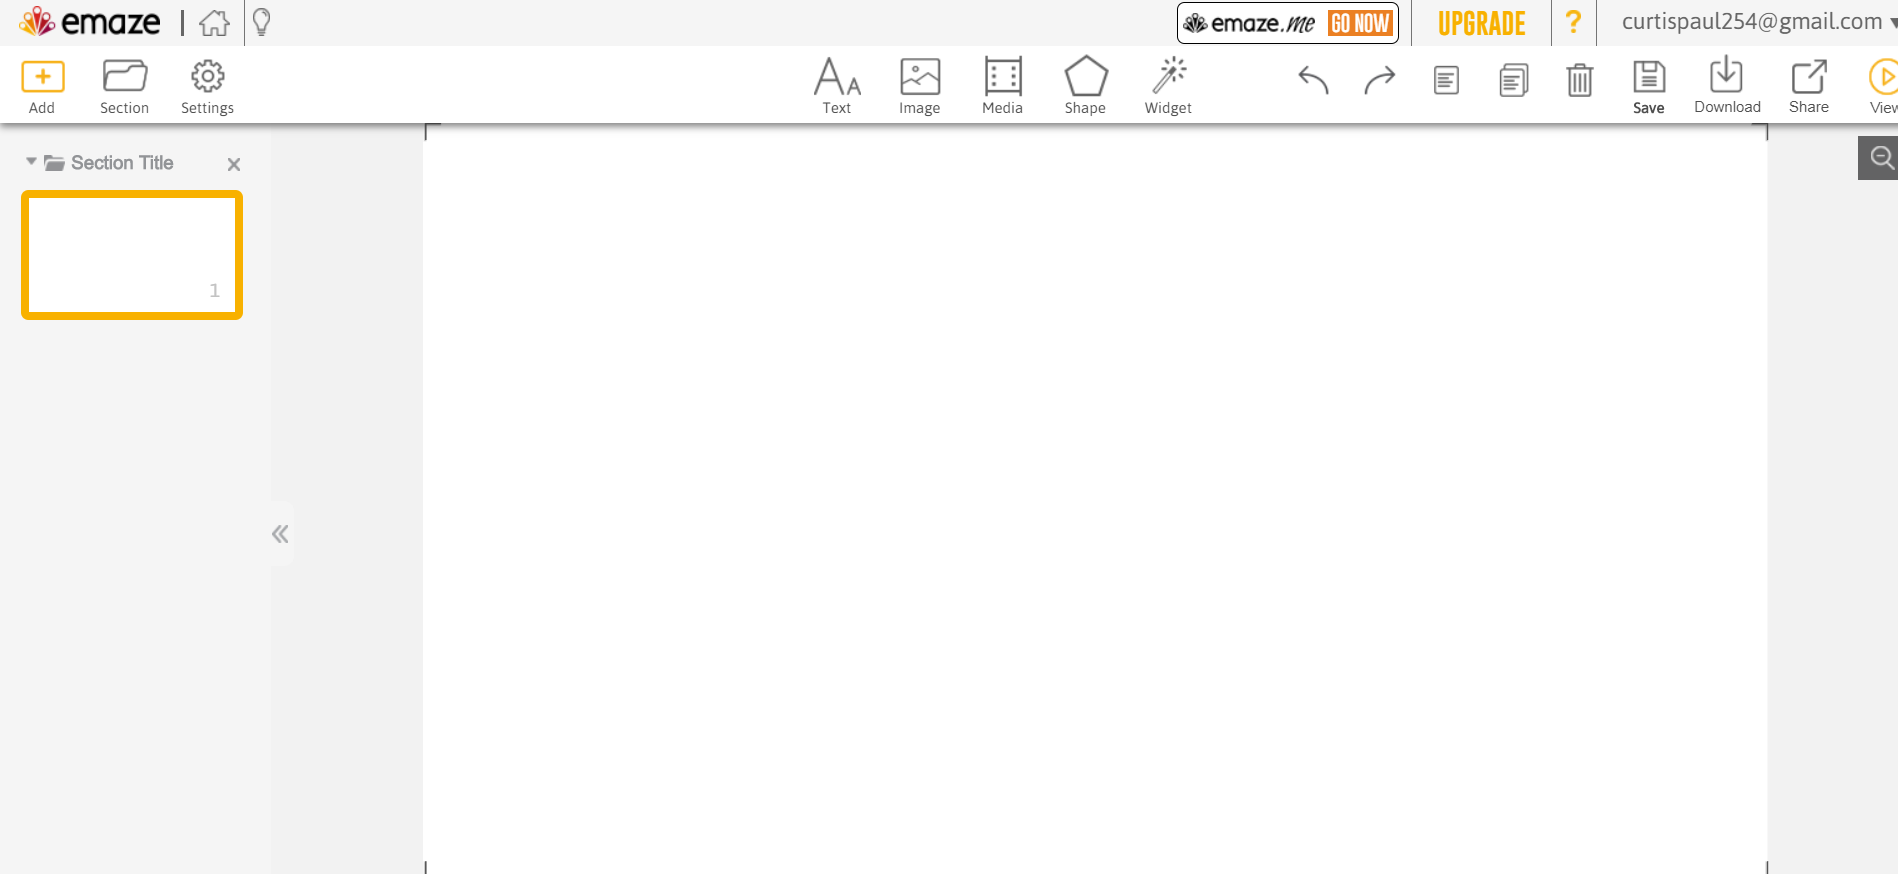
You can also choose to create a blank one. For this just click on the Blank option. A blank canvas will appear where you can begin working on your content.
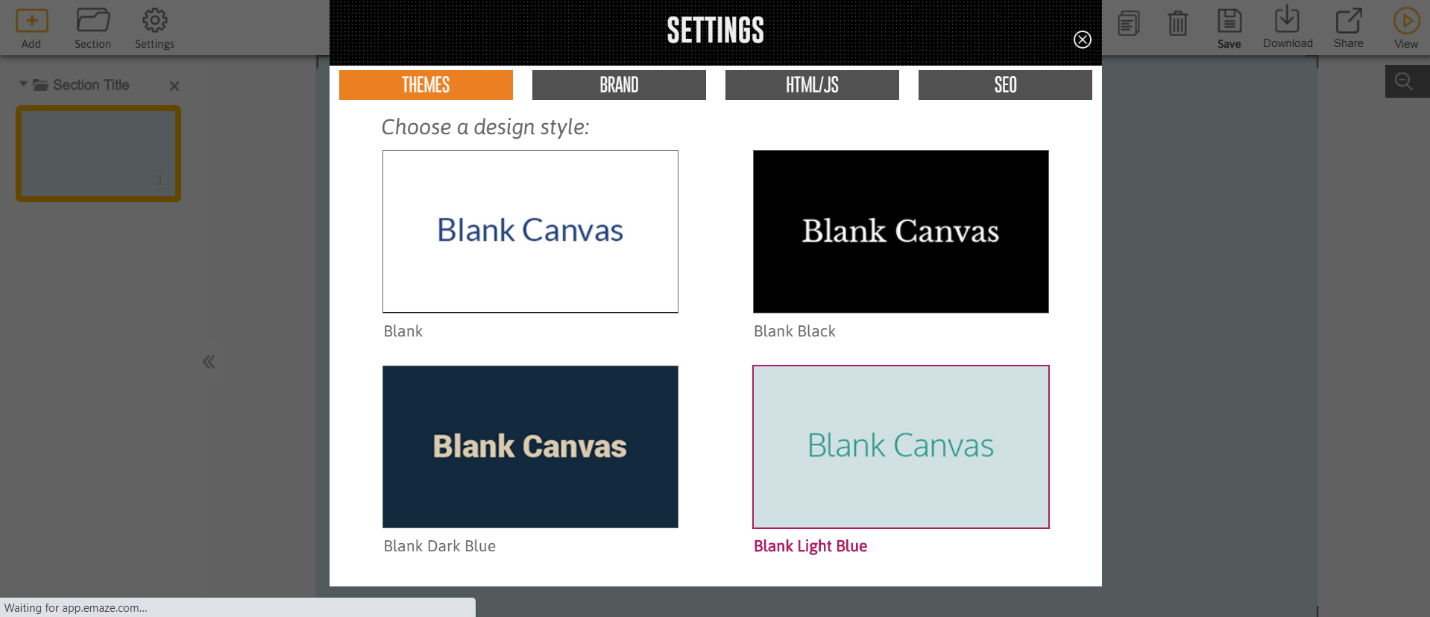
To add a background to your canvas, click on Settings and pick one from the ones Emaze provides.
Click on the Image icon right above your canvas. This will give you several options to choose from. For free images go to imagesload.net and search for an image you like. Copy the URL of the image and paste it in the search bar. Click on Add and your image is sent to the canvas.
Here is what mine looked like:
(https://imagesload.net/view/black-man-and-woman-touching-chin-transparent-background-png/BCd9n)
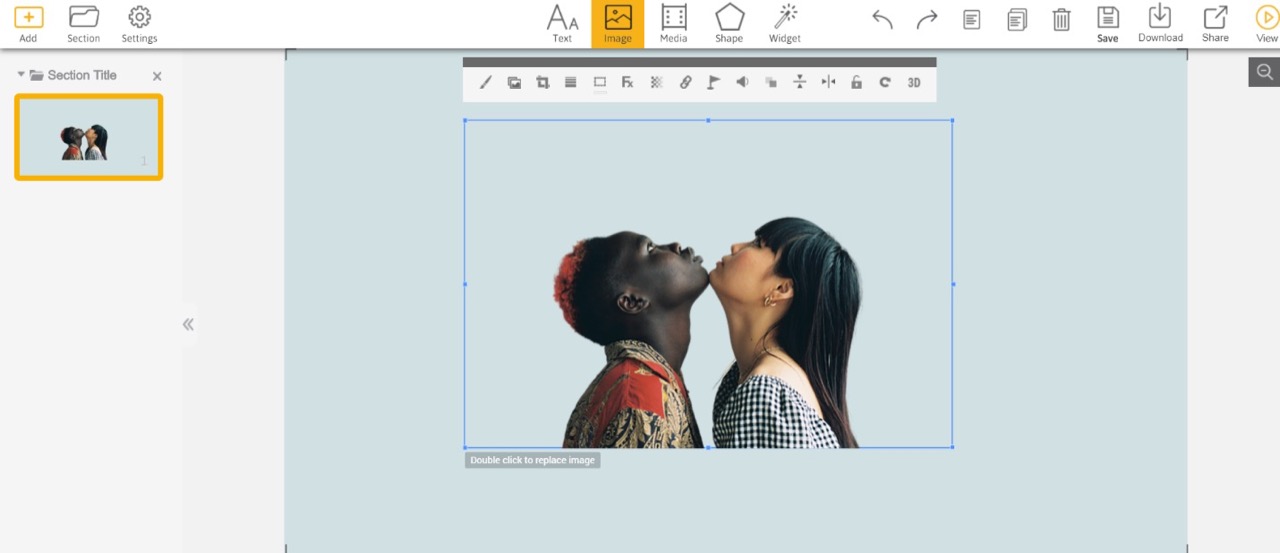
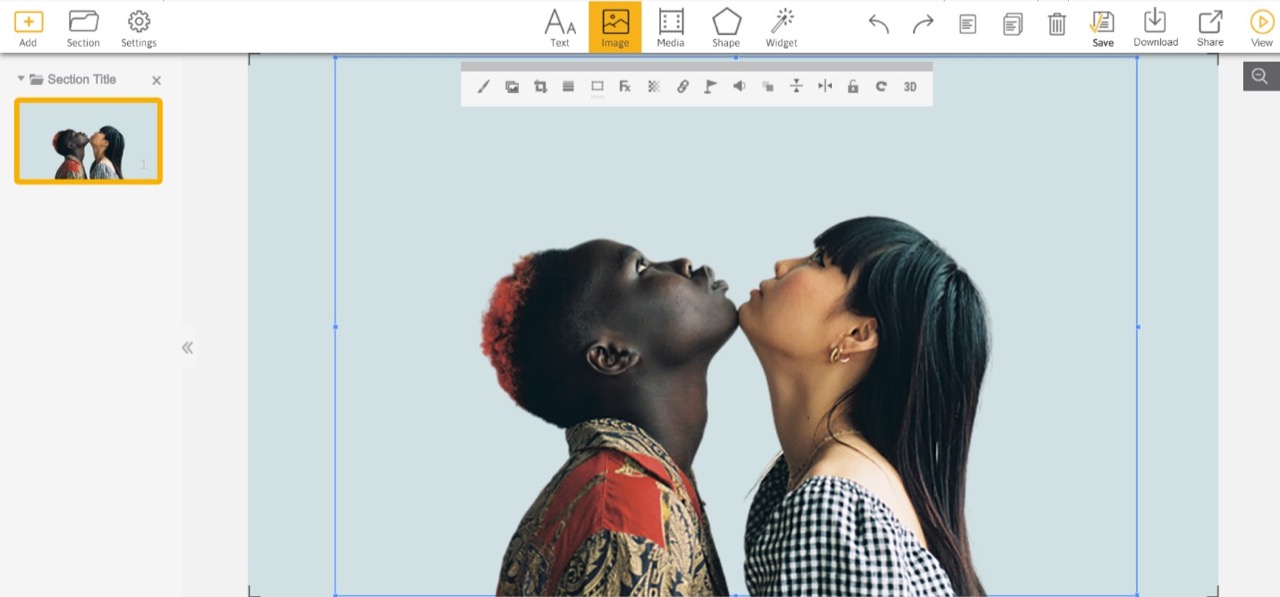
Play with the edges of your image and make sure it fits well onto your canvas.
You can edit the features of your image using the icons that appear right above your canvas. Adjust these until you’re satisfied with your image.
Proceed to add your text appropriately. You can drag the text boxes to resize them or position them in the canvas wherever you desire.
You can edit your text accordingly by using the icons that appear in the text tab above your canvas.
While at this you can add shapes from the bar above your canvas by clicking on the Shapes option.
Here is what mine looked like after adding text and after editing.

After this you’re basically done with your infographic. For whatever content you’re creating be sure to play around with the controls for maximum output. Click on Download to get your content. You can also click on the Share button to share your infographic. It took me less than 10 minutes to finish my infographic. Try and make yours more detailed and eye catching.
As you can see, Emaze allows you to make use of its many features to customize your content to your liking. Better still, it’s easy to use and doesn’t take you much time. The content you produce is guaranteed to be of high quality too. What else could you ask for!
Read more6 years ago / Admin
The main purpose of creating an infographic is to present information quickly and clearly. Infographics help improve cognition by utilizing graphics. These graphics enhance a human’s visual system to see patterns and trends. Infographics are easier to understand and grasp than normal texts.
At times, creating a simple infographic can be a hard and daunting task. This is especially true if you’re using the wrong application/ tool. Some of the available tools e.g. Adobe In-Design, Photoshop, Canva etc. are complicated and costly. This can be a huge drawback especially if you just want to create a simple infographic. Other tools like MS Paint and PowerPoint are too basic and don’t offer much in terms of features.
Introducing Lucidpress. This is a content creation tool which is both easy to use and considerably cheap (for the paid version). If you are not looking to spend money, Lucidpress also offers a free trial. With this tool you need not worry about the quality of your content. It has a variety of in-built features that will enable you customize your content to your liking.
From full text control to the drag and drop functionality, Lucidpress is guaranteed to help you create high quality content without much fuss. It also fills a niche for content creation and collaboration. Introduced in 2013, its design capabilities range from single page documents e.g. Business cards, Flyers, Posters etc. to multipage documents such as Annual reports and Magazines.
1. Incorporates a real time collaboration editor.
This allows multiple users to edit a document simultaneously. Users can also make comments and chat with collaborators in real time.
2. Publication
Lucidpress allows you to publish your content through;
3. Cloud based
Lucidpress is compatible with modern-day web browsers such as Google Chrome, Firefox, Safari, and Internet Explorer. Your documents are also securely stored in the cloud. Lucidpress started as a platform for single users and small businesses. However, over recent years it has found a larger user base in both the education and enterprise niches.
As of 2020, Lucidpress has 8 million users. There are tons of reviews left by users and some of these include;
Pros:
Cons:
Lucidpress is extremely user friendly. One does not need formal training to use the tool. All you need is a Lucidpress account (which is free) and your creativity.
Step 1: Log in to Lucidpress.
Go to www.lucidpress.com.

Enter your email address. You can then choose the option Get started. If you already have an account you can simply just log in.
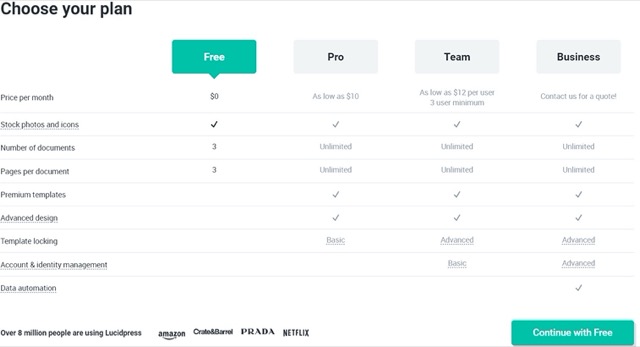
Step 2: Choose a plan
You will then be redirected to a page where you’ll be required to choose a plan. For purposes of this guide I chose the free version. So click on free and then click on Continue with free.
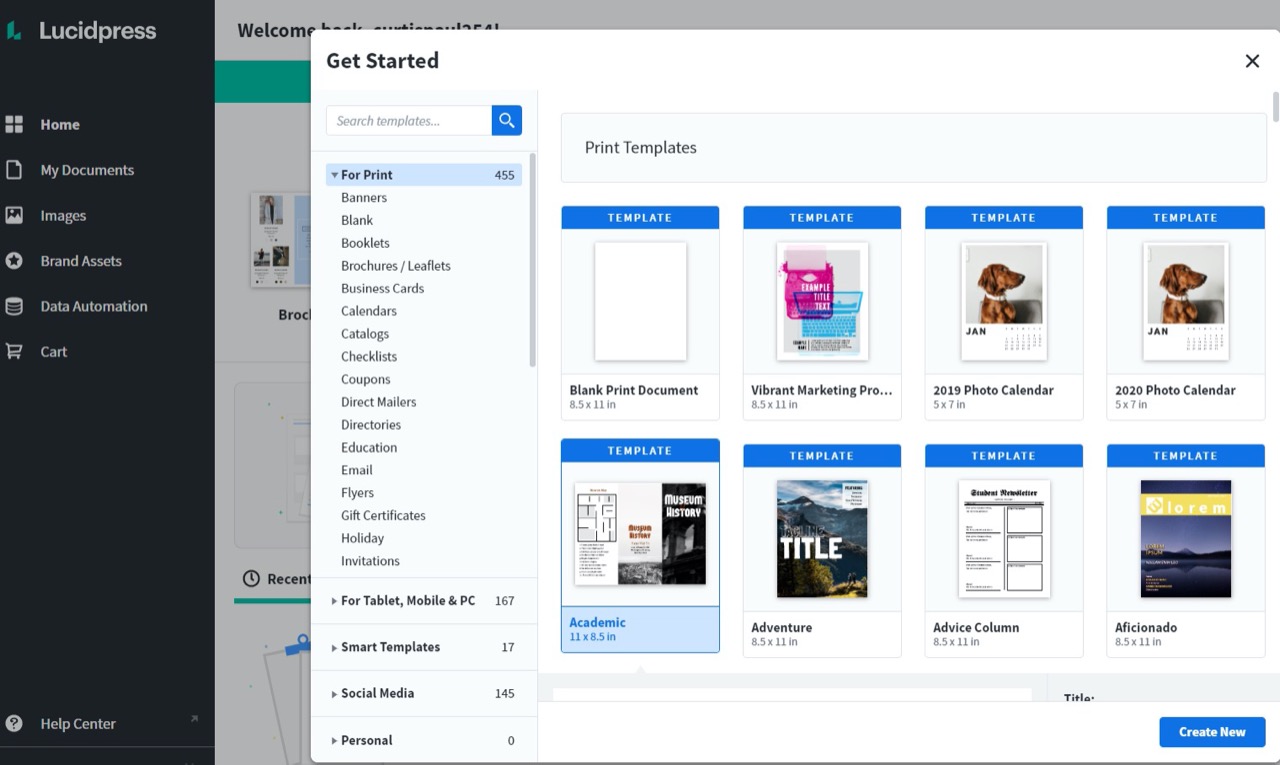
Step 3: Choose a template
You can now begin designing your infographic. You can choose from the available templates or even search for more. You can also design your own template from the Blank Print Document option.
Make sure the template you pick is ideal to your needs. Whether it’s a poster, brochure, booklet, flyer etc. that you’d like to create, you can find the options on this page.
After finding your preferred option click on Create New.
For this guide I’d like to create an original business flyer without using an already existing template. So I’ll click on Blank Print Document and then Create New.
Step 4: Choose a custom template size.
In the Size and Orientation toolbar there is a number of standard template sizes you can choose from. I will leave my size as it is and change the Orientation to Landscape (Vertical)
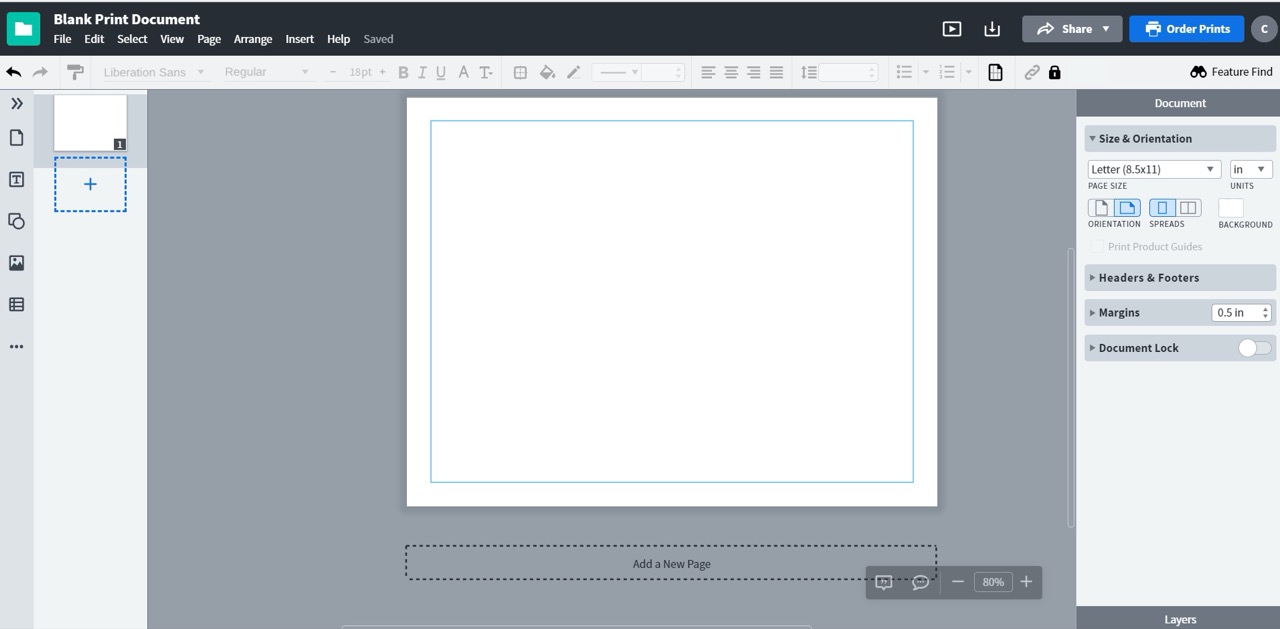
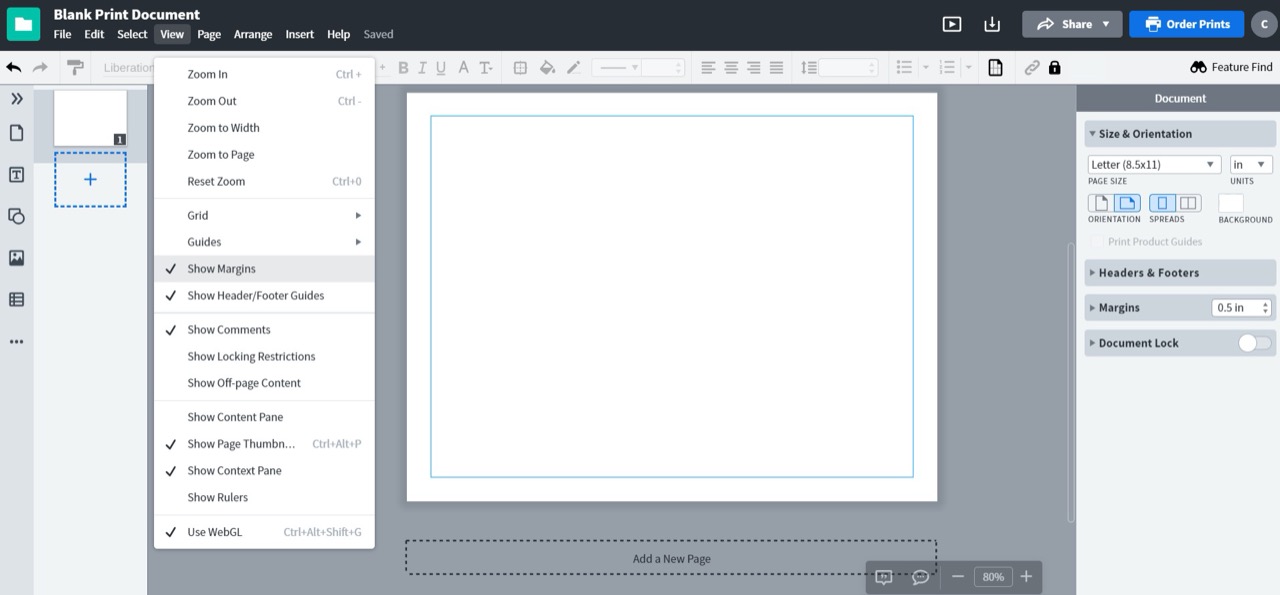
Note: Keep your main design within the margins (In blue) so that nothing gets cut off if you get this printed. So click on Views and make sure Show Margins option is active.
Step 5: Add background image.
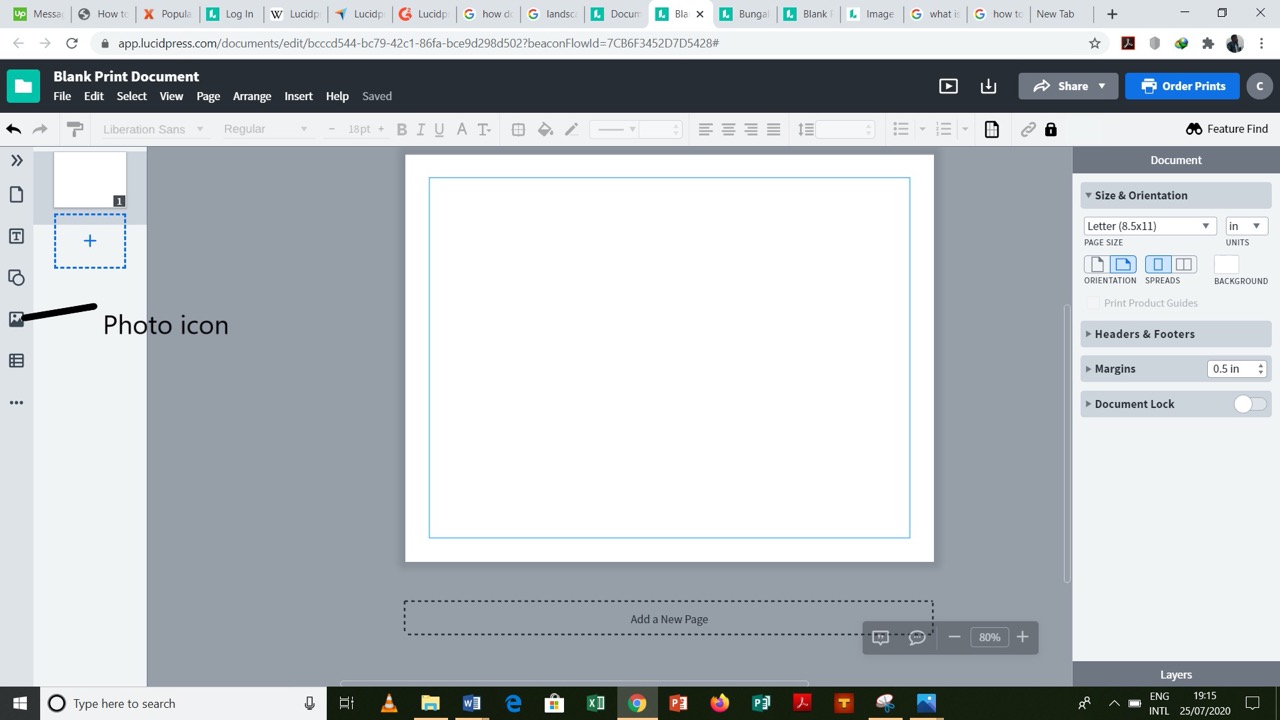
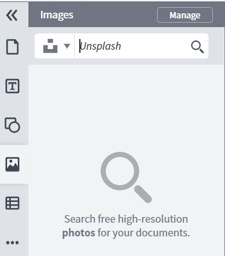
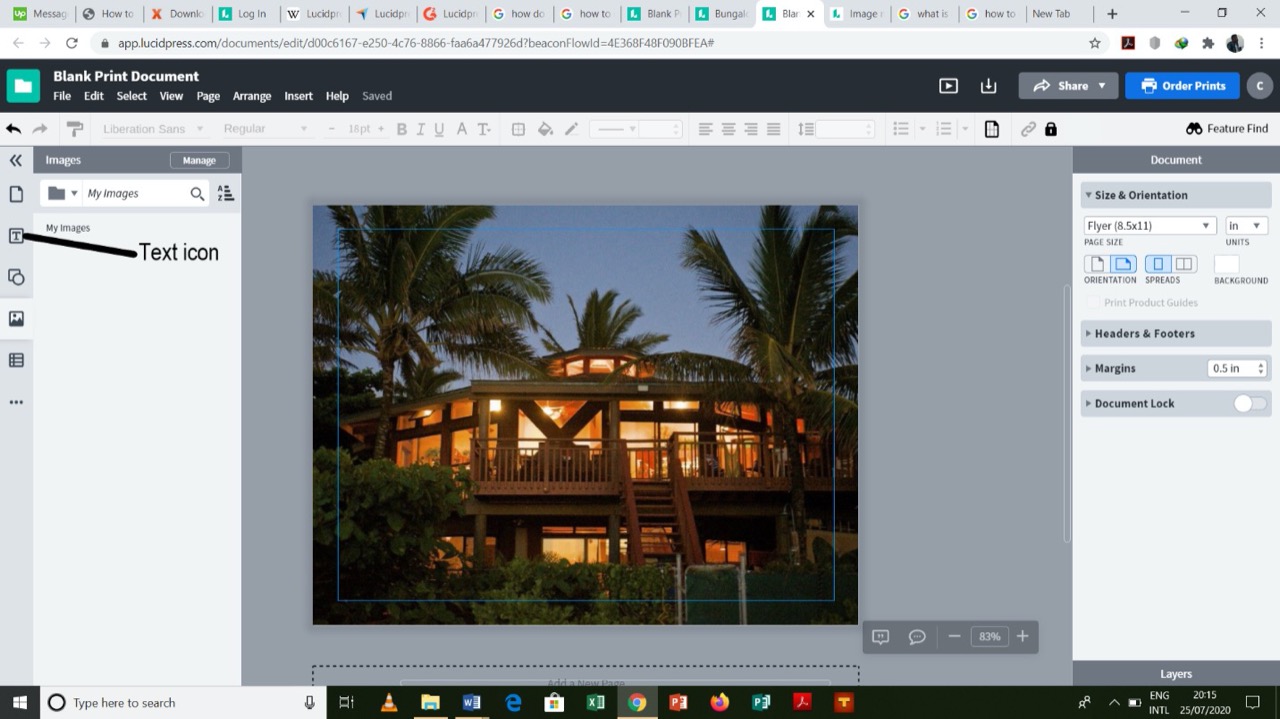
The next step is to find an appropriate image for the infographic you are creating. Click on the picture icon on the left of your screen.
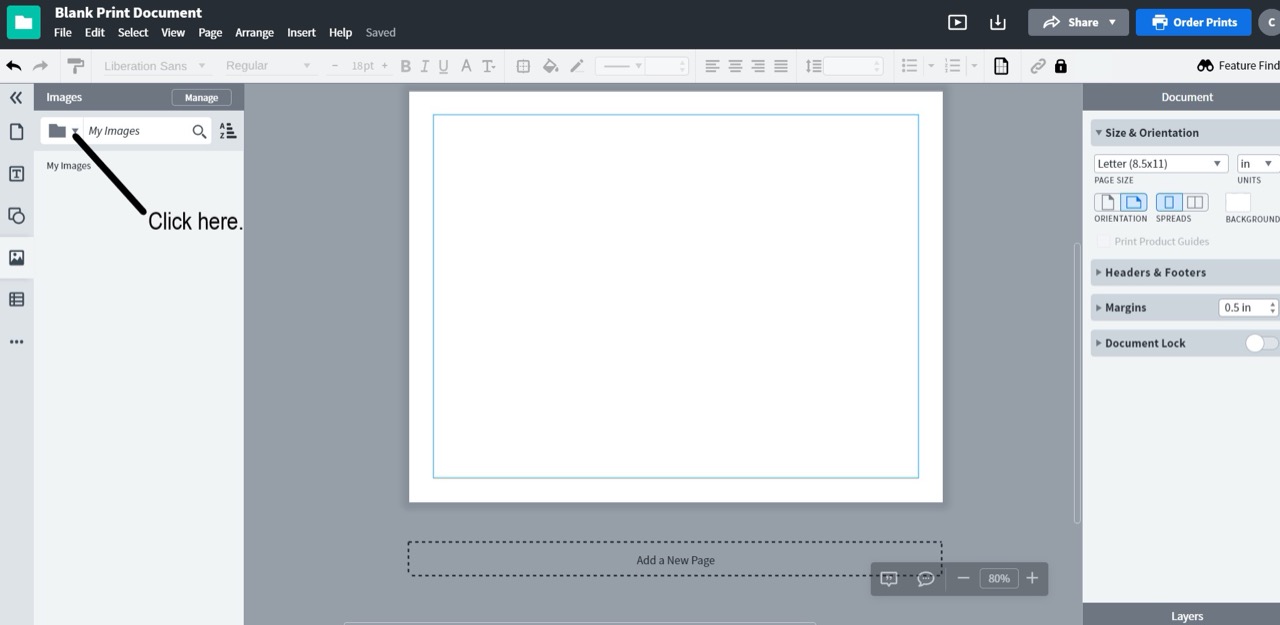
The following dialog box will appear. Click on the drop down menu for the folder icon.
A number of options will appear after clicking this;
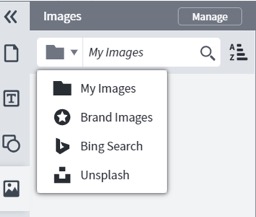
The aim is to use a free image so click on Unsplash
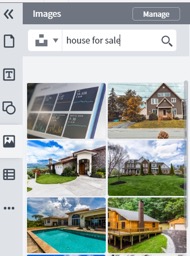
As you can see Unsplash offers free high resolution photos. Type into the search bar and pick whatever image appeals to you. In my case I’m looking to create a flyer for a Real estate business so I’ll conduct a search for this. Several options turned up so I picked one of them.
Click on the image you like and drag it into your workspace.
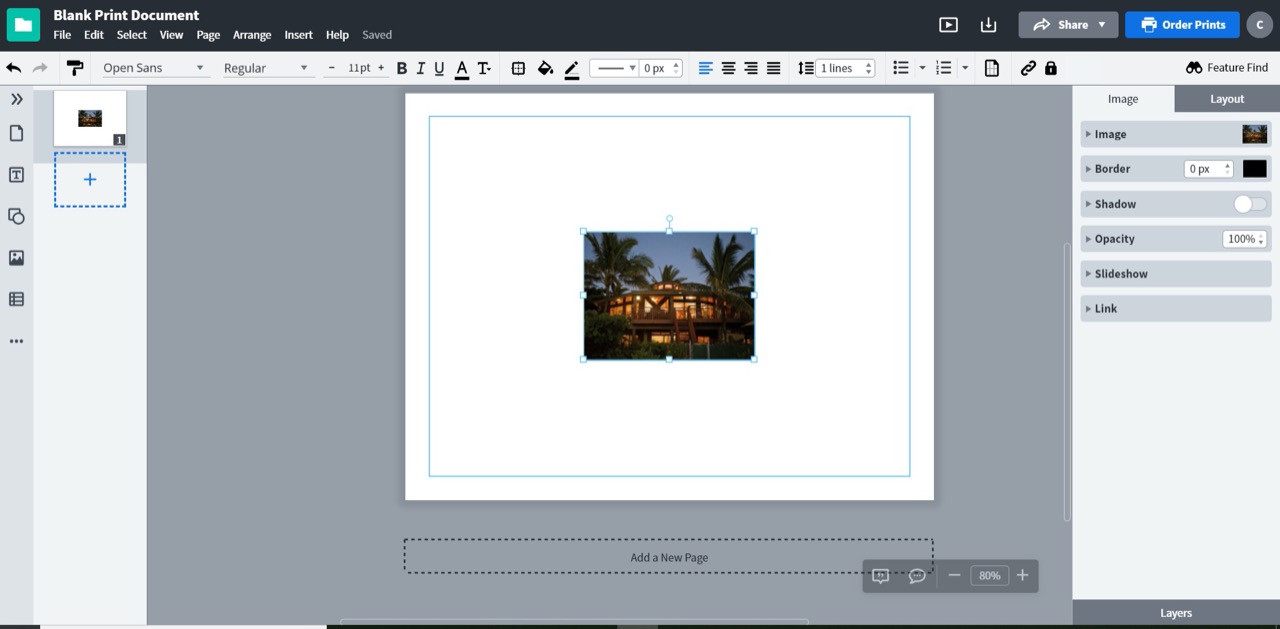
Step 6: Foreground images
So you get background images from unsplash. What about foreground images. You can add them from My Images, however where do you find free foreground images? The problem is always going to be that they will have sort of background. This is where you can images from https://imagesload.net. There's a huge range of images with transparent backgrounds so you can simply add these to your work. They are all creative commons free!
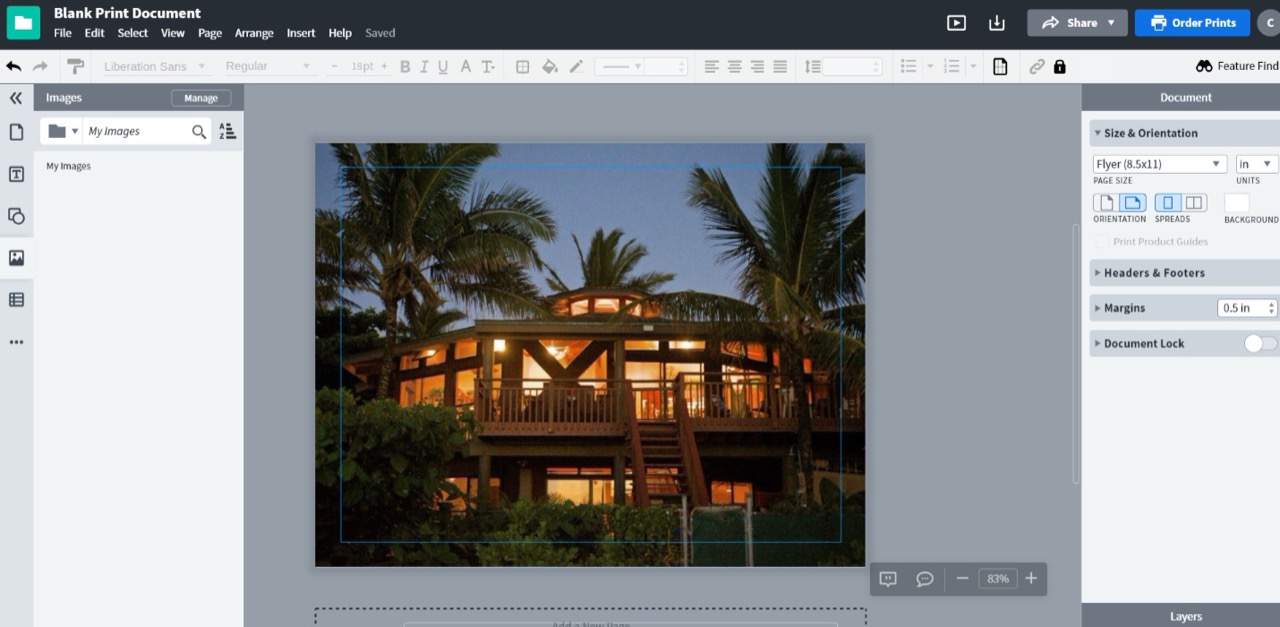
Step 6: Edit Image
After this process resize your image so that it fills your canvas. Mine looked like this;
Step 7: Add text and adjust its formatting.
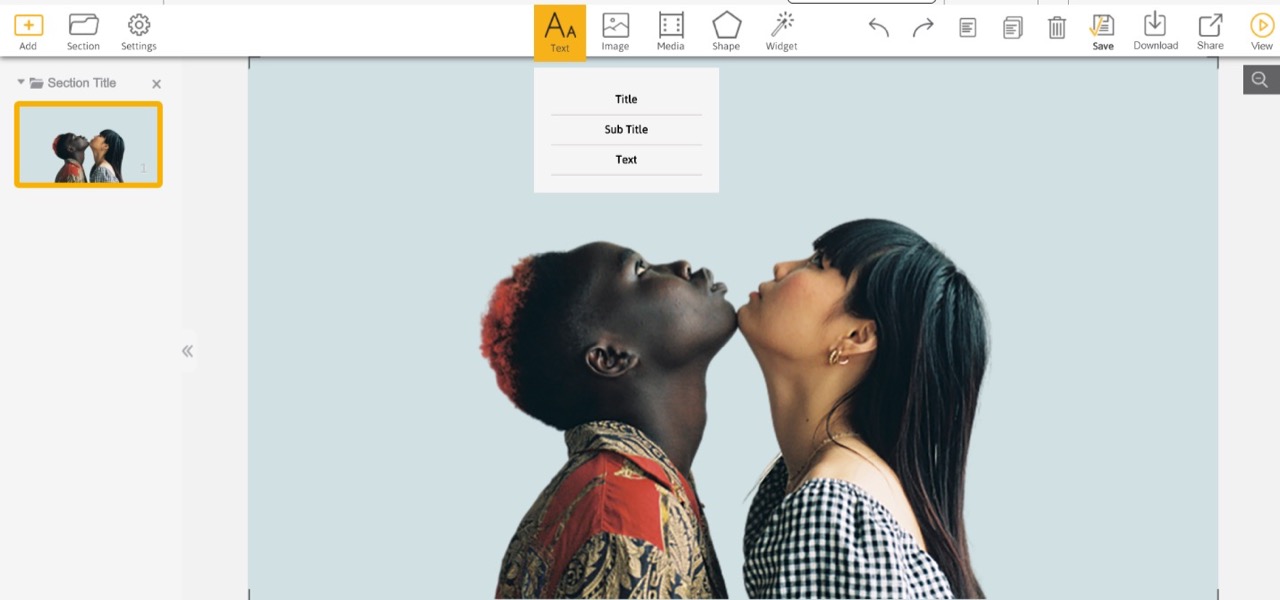
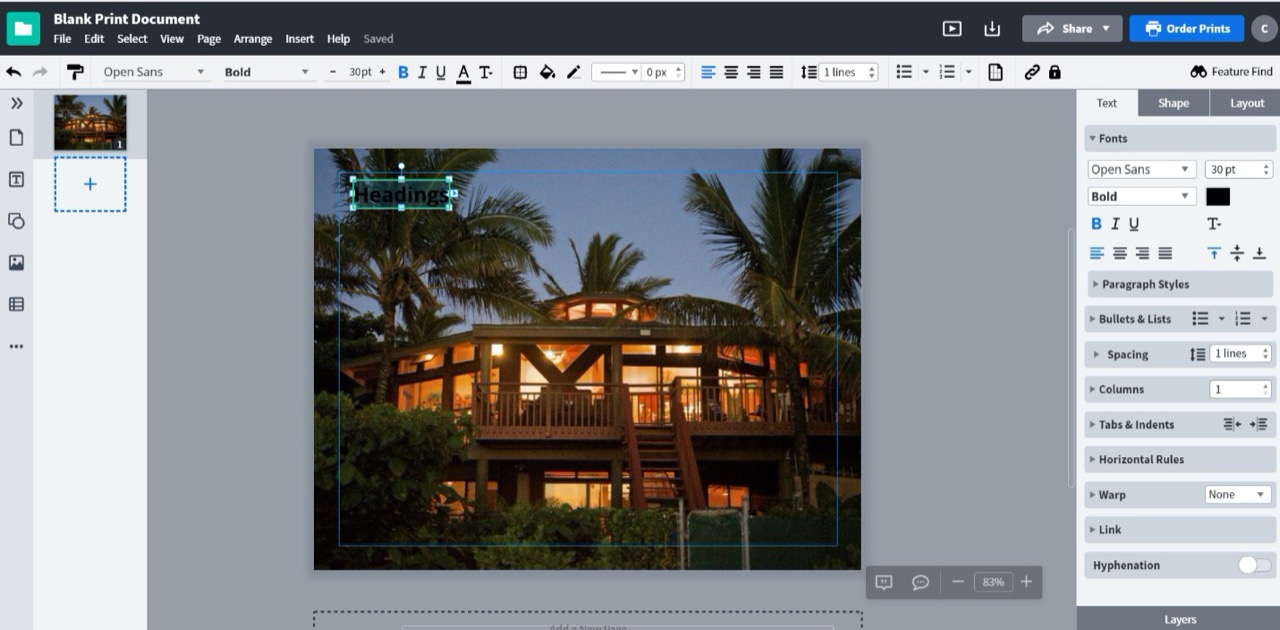
Click on the Text icon on the left side of the screen and drag it into your workspace. You can pick either the Headings choice or the Subheadings. It all depends on you.
Position the text box where you’d like it to be. Type in your text. You can adjust details such as the font and its size. Adjust the size of your text box if your text is too long (just drag one corner of the box)
Note: At times the background image can make your text not be visible. Adjust the fill in the Fonts command to make it visible.
You can also add shapes as well as other features to your infographic. Again, it’s all according to your preference and the type of infographic you’re creating (see the icons on the left side of your screen).
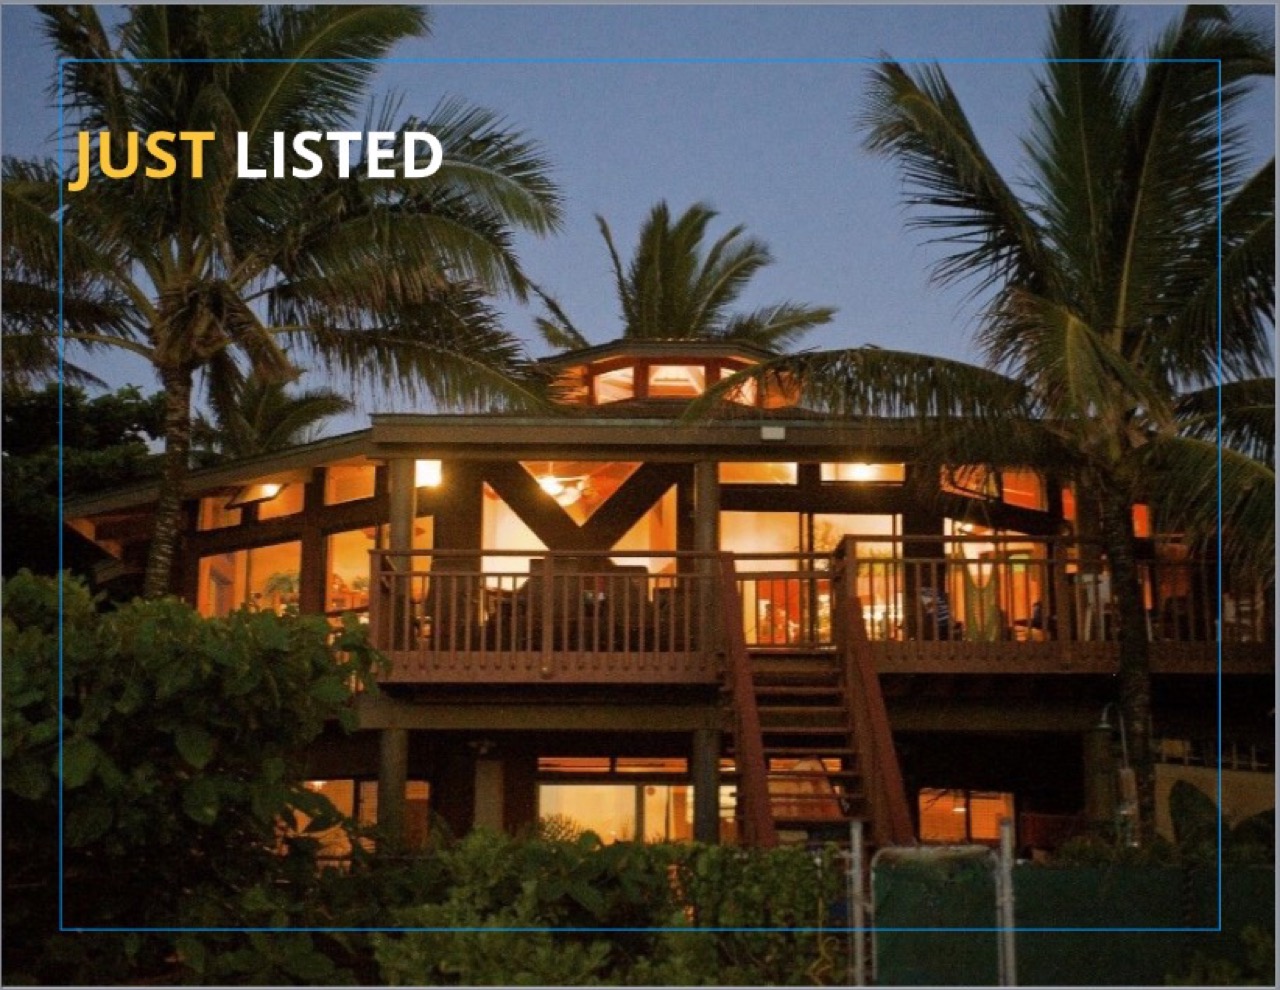
This is what mine looked like after tinkering with the title a bit.
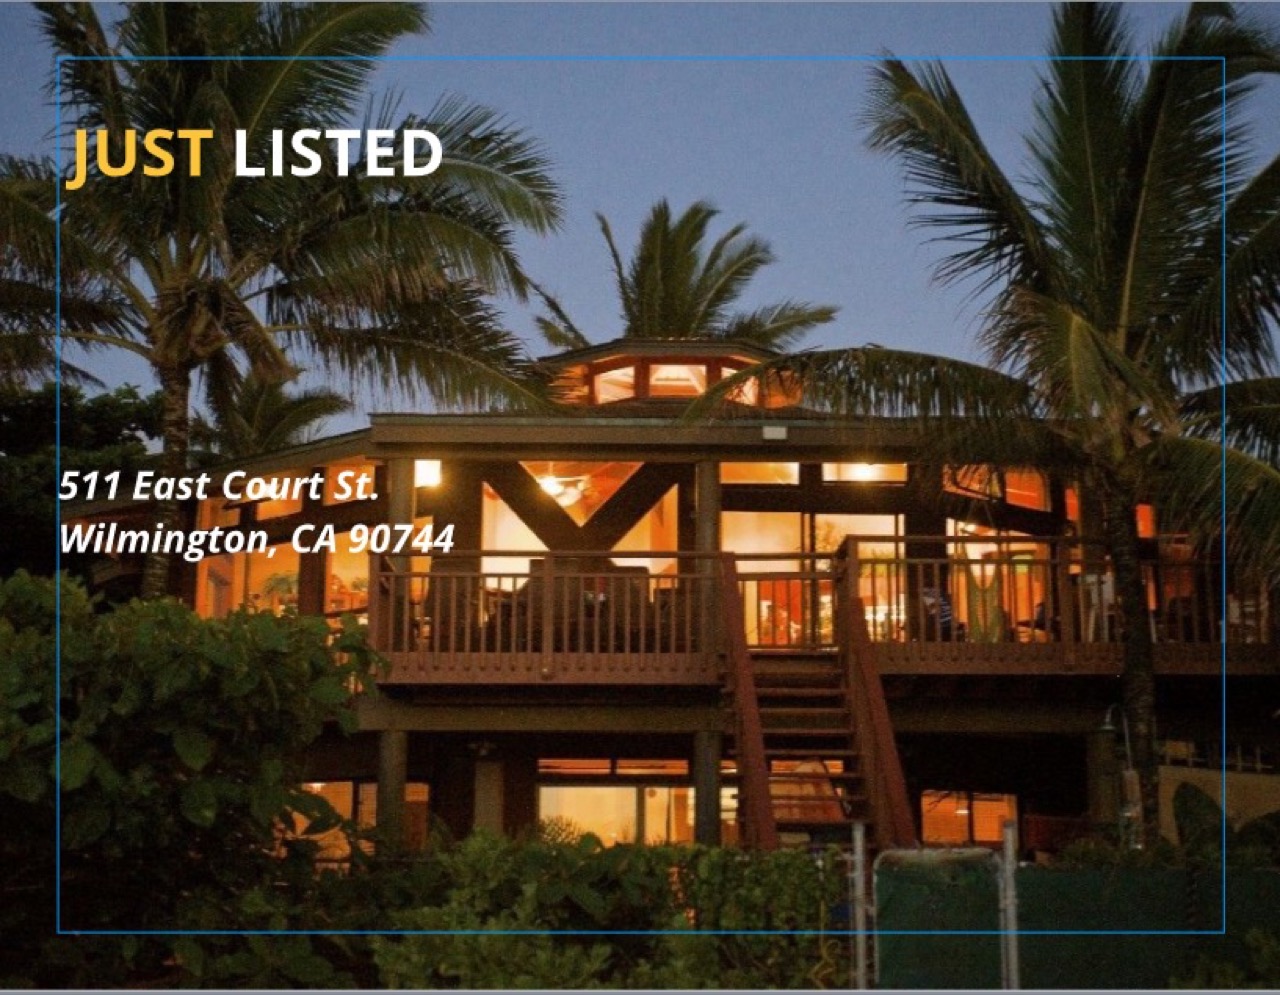
Step 8: Add other relevant text.
Final steps
Try and play around with the commands so you get a feel of everything. You can always press Ctrl+Z on your keyboard to undo an action.
This will open a bunch of options for you to choose in what format you’d like to download. You can choose to download in PDF, PNG OR JPEG formats. Finally, click Download.
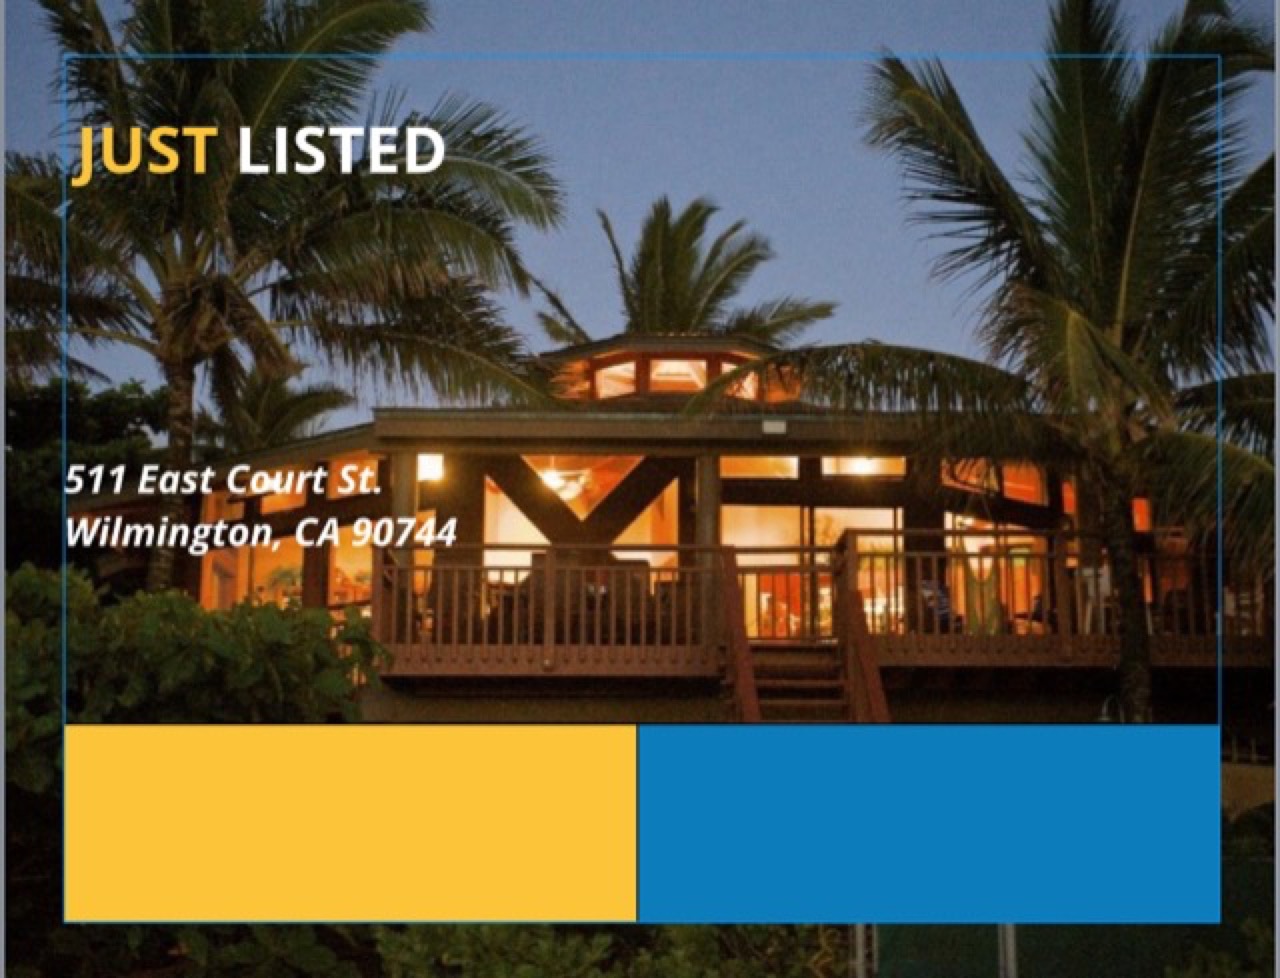
And voila! The final product.

As you can see, creating an infographic using Lucidpress is simple. There are no complicated commands. You can spend time playing around with the features and within no time you’ll be a pro. This was my first time using Lucidpress and it didn’t even take me more than 30 minutes!
You can create infographics with all manner of combinations of the different features without much trouble. Consider giving Lucidpress a go and you will be guaranteed high quality content that is easy to create.
For royalty free / creative commons images for your infographics, you can go to https://imagesload.net
Read more